CPI in 2015 Highest on Record: Inflation Deniers Beware
David Kreutzer, an economist at the Heritage Foundation, is one of my favorite guys in the climate change debate. (I invited him to the IER conference on carbon tax that I organized.) Today he sent me his recent article in the Daily Signal reacting to the NOAA report that 2015 was the second-hottest US year on record (since 1895), a fact that produced obvious reactions from various carbon tax advocates.
Out of curiosity I clicked the links through to NOAA’s actual data set, and remarked to David that if we rank the years from 1895-2015 from hottest to coolest, then the top 5 years include 1998 and 1934, which is a bit odd if you think CO2 is the big driver.
That made me relate the issue to monetary and price inflation. Most economists would agree that the main driver for rising consumer prices is a rising quantity of money, especially over long stretches of time. It would be inconceivable that if you ranked the years 1895 through 2015 in terms of the level of prices (not the annual rate of price inflation, mind you, but the level), that two of “the most expensive” years would be 1998 and 1934.
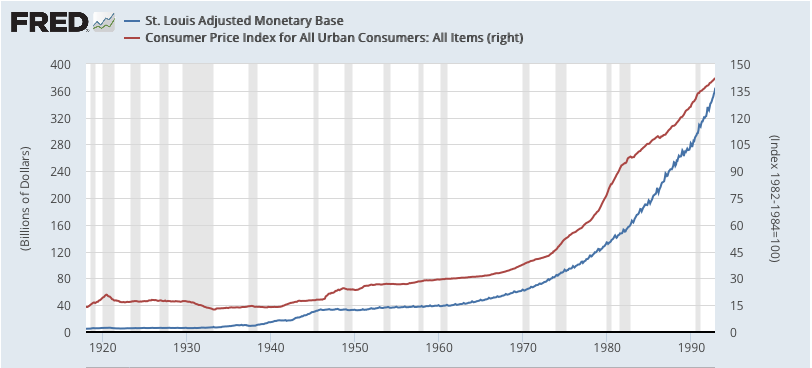
At this point I really wanted to waste some time, so I decided to generate some graphs to illustrate my point. First let’s do monetary vs. price inflation. If we go from 1919 through 1992, it looks like this:
Note that in the above, I chose the monetary base (rather than M1, M2, or some other potential aggregate) because that’s the series FRED had furthest into the past.
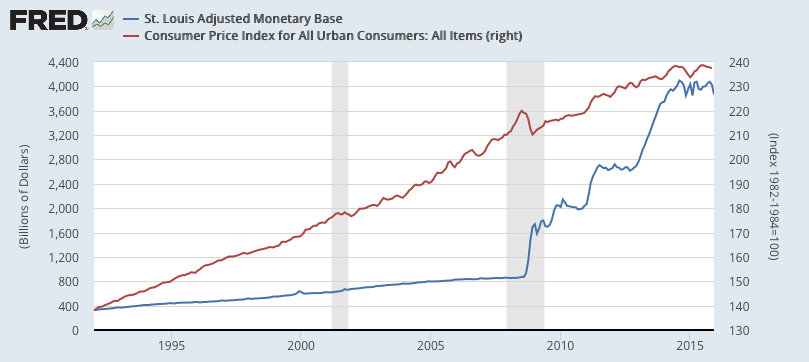
It’s a pretty good fit, isn’t it? Of course, it’s not perfect, and if you calibrated a computer model with the above, you would’ve been caught flat-footed when the huge expansionary of the monetary base since 2008 didn’t generate comparable increases in CPI:
(Ideally I would have kept the tight fit of the two lines up through 1992, and then had the blue line explode upward while the red continues its gentle increase, but I couldn’t figure out how to make FRED do that.)
So, if we want to make an analogy with the climate debates, we could imagine some poor economists who had been warning of price inflation being perplexed by the above. They might speculate that the excess reserves went into the ocean, and would show up eventually in higher consumer prices. (That was Cliff Asness’ awesome tongue-in-cheek response to Krugman.) Yet even so, given the pretty tight correlation in the past, and the unusual nature of events since 2008–not to mention investors thinking that perhaps that monetary base will eventually be sucked out of the system–you can see why the inflation hawks would not think their worldview had been utterly smashed.
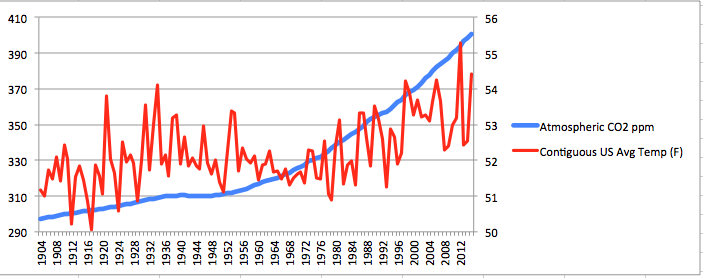
Let’s turn now to the issue of atmospheric carbon dioxide concentrations and (U.S.) temperatures. Here’s the chart relating the two, though I caution you that scientists only have direct observations of atmospheric CO2 from 1959. Prior to that, they estimate it using ice core samples. In any event, here you go:
In case you’re wondering why I started at 1904, the answer is simple: Excel didn’t recognize it as a valid date if I went back to 1903.
Perhaps I’m biased, and you can try putting it in Kelvin to see if that changes things, but that doesn’t look like nearly the no-brainer connection as we had with money and CPI. For example, the U.S. average temperature in 2013 is about the same as it was in 1910, even though CO2 concentrations were up almost a third. Average temperature in the 1930s was 0.3 degrees higher than in the 1980s, even though average CO2 was 12 percent higher in the 1980s.
Before closing, let me reassure my scientifically literate readers that I have read lots of the IPCC material. I understand full well how a climate scientist who is alarmed about anthropogenic climate change would explain the above. But my point is that even though in the past I have whimsically made a comparison between people (like me) who warned of large consumer price increases and those (like Krugman) warning of large temperature increases, I think the people in my camp have been much more reasonable about it.
Murphy Explains His Connection to “Infinite Banking Concept” at Summit in November
This was a short talk I gave at a meeting of financial professionals back in November in St. Louis. Either way, check out the discussion about the stock market starting at 21:00.
Step #4 In My Dispute With Beckworth: The Market (Apparently) Lowered Forecast of Future Fed Funds After Critical 2008 Meetings
I have a running response to David Beckworth’s defense of Sen. Ted Cruz’s remarks concerning the causes of the 2008 financial crisis. (Here are links to #1, #2, and #3.) This, #4, is my final argument, though I may do follow-ups based on reactions from David and/or his fans in the comments.
In earlier steps I pushed back on Beckworth’s argument that because the spread between long and short Treasury yields increased during 2008, that this meant the market was expecting a future rate hike.
However, Beckworth had an independent empirical argument in defense of Cruz. Specifically, Beckworth posted a chart that seemed to say that expert forecasts of the 3-month T-bill yield rose as 2008 progressed. Now, I am not sure that the chart means what Beckworth says it means. But, I think that it’s a moot point, because rather than look at expert forecasters (a term that would make Scott Sumner choke on his beverage), we can look directly at what “the market” thought, by using prices on futures contracts.
Furthermore, since we’re talking about Fed policy, we can look directly at the federal funds rate.
In response to my request for reader help, DMS gave us the market’s implied forecast of the fed funds rate for November 30, 2008. I was waiting until I had time to independently verify his calculations, but I am swamped and I thought it more important for me to make this post while people still vaguely remembered I had been arguing with Beckworth. So, by all means, please investigate and make sure you agree with how DMS translated the actual price of the futures contracts into implied fed funds rates.
In any event, here is the information I can compile from DMS’s report:
The Implied Market Forecast of What the Fed Funds Rate Would Be on November 30, 2008, as of Various Dates
6/24 – 2.465%
6/25 – Fed makes policy announcement.
6/26 – 2.34%
8/4 – 2.16%
8/5 – Fed makes policy announcement.
8/6 – 2.12%
9/15 – 1.78%
9/16 – Fed makes policy announcement.
9/17 – 1.65%
So assuming DMS correctly calculated the implied market forecasts of what the fed funds rate would be on November 30, 2008, it seems that the two summer Fed announcements, as well as the critical Lehman announcement, were all associated with a drop in what the market thought the policy rate would be, for a fixed future date.
At this point, I think Beckworth should (if he has time to process this) give one of three types of responses:
(A) Point out that there is something wrong with the above numbers.
(B) Agree that Cruz’s version of history is utterly baseless, and that it was not so much any particular policy pronouncement that made people think the Fed was tightening, but just a general shift in expectations over 2008 that we can’t really attribute to anything specific.
(C) Agree that Free Advice has been the single best source of monetary analysis for years and apologize profusely for calling for monetary inflation.
I am not hoping for (C), but (B) would be nice.
Continuing With My Questioning of Sumner
Scott partially answered my question (which I posted here for your viewing convenience), but he didn’t elaborate on why he uses the formula (i-IOR) to get his desired result that IOR is contractionary, even though higher interest rates per se are expansionary. (It should go without saying that I’m just dabbling within Scott’s framework to make sure it’s internally consistent. Obviously I don’t think it’s useful to classify “boosting NGDP” as “expansionary” etc.)
In the comments here at Free Advice, Aaron gave the natural answer:
Bob,
i–IOR is th relevant number because IOR is the floor at which banks will lend. No one in their right mind will lend below IOR.
Before IOR, the floor was zero, so i–IOR = i. Now is not. So to compare historic data, your have to subtract IOR.
I agree that this is probably the reasoning Scott is using (though he never spelled it out). But if so, there are some problems. Very quickly:
==> Banks aren’t the only actors in the economy. There are businesses and households that hold cash balances, and factor interest rates into their decisions. So if interest rates across the economy go up because the Fed hikes IOR, then doesn’t that make everybody in the economy less eager to hold cash balances? Yet only the commercial banks are getting the subsidy. To switch examples: If the federal government starts stockpiling wheat and thereby raises the market price, that would still cause consumers to buy less bread. We wouldn’t say, “Nah, this is a subsidy and so the relevant metric is b-w, where b is the market price of bread and w is the subsidy price the government pays farmers for wheat.”
==> Even if we focus just on the commercial banks, it’s not obvious to me that they only care about the spread, as opposed to the absolute value of the market interest rate. The reason is that the Fed is simply a very safe borrower, from the perspective of the commercial banks. For example, forget about IOR; imagine it’s back in 2004 before that policy. Now some major housing developers approach the commercial banks looking to borrow money, and that pushes up market interest rates from 3% to 4%. Would Scott say that this isn’t expansionary, because the banks really care about (i-d), which is the market interest rate minus how much they can earn if they lend to the developers? Of course not; that doesn’t even make sense. So by the same token, when the Fed comes along and says, “Hey, if you ‘lend’ your reserves to us, we’ll pay you 25 bps instead of 0 bps,” I don’t see why that is qualitatively different from increased demand for reserves from any other borrower.
==> Even if you think the above two points are wrong, I have a third, independent problem with Scott’s analysis. Let’s say the Fed raises IOR by 25 basis points. Scott wants to say, “That’s contractionary because the relevant metric is i-IOR, and the Fed just raised IOR.” But hold on. An immediate reaction is for i to rise in response. Without Scott telling us more, I think most people would assume market interest rates in turn would all rise by 25 bps as well. So it would seem to a first approximation–using Scott’s stipulated framework–IOR should have no effect. In other words, any increase in IOR will presumably cause i to increase by the same amount, and so the metric (i-IOR) is unaffected by the policy of IOR. And yet Scott has spent the last 7 and a half years arguing quite vigorously that IOR is contractionary.
If this were just some minor point, I wouldn’t be making such a big deal out of it. But since the issue of IOR (and the possibility of negative IOR) has been floated for years by Market Monetarists as the smoking gun against the liquidity trap, I think Scott should at some point clarify how all this works, when his most recent posts are arguing that lower interest rates are contractionary per se.
Federal Debt “Held By the Public” as Share of GDP
Someone making a video asked me to dig this up, so I thought I’d share it with you guys too…
Sumner Arguing That Low Interest Rates Are Contractionary
Scott has been posting some interesting stuff on this topic (one, two, three). Many of you–and Scott himself, at the tail end of this post–are bracing for me to go nuts, accusing him of all kinds of inconsistency. But nope, I am far more judicious than you realize.
However, I do think there is something not quite right in how Scott is discussing these matters, particularly when it comes to the Fed’s new policy (since 2008) of paying “interest on reserves” (IOR). Here’s the comment I just left:
Scott,
I’m actually mostly on your side on this one (believe it or not). But I do have one major doubt in the way you’re handling it.
How can you be sure that even a textbook rate hike (accompanied by reduction in reserves) is contractionary relative to the status quo? Wouldn’t it depend on the elasticity of velocity (or something like that)?
For example, if the Fed raises rates from (say) 4% to 5% and it does so by reducing the monetary base by (say) 2.3%, then to know the impact on NGDP, wouldn’t you need to pit the two forces against each other to see which dominates? Isn’t it conceivable that the point rate hike causes velocity to increase by more than 2.3%, and thus the smaller base is still generating more NGDP?
And then, it seems to me that it should be a no brainer that IOR is expansionary, since it doesn’t reduce the monetary base and increases interest rates. If you want to make an argument about fractional reserve banking and how a hike via IOR reduces M1 and the other broader aggregates, OK that at least makes sense, but I haven’t seen you make that argument.
Do you understand my confusion? I hope I’m at least making sense.
A Fun Potpourri
==> Hillary Clinton says aliens may have already visited us, and back in 2009 she referred to the New York CFR office as “the mother ship.” I’m not saying she’s an alien, but…
==> Brittany Hunter wants libertarian women to be careful not to go for the cheap tactic of using their looks to get viewers. She holds up Julie Borowski as the way to do it right. Fair enough, but if you think I would’ve done the below for 3 dudes, well… You are mistaken.
Lew Rockwell Joins Tom and Me to Discuss Krugman’s Column
This was a fun discussion. If you only listen sporadically to Contra Krugman, this is a good one to pick. The specific topic is Krugman’s claim that today’s Republicans are radical small-government nutjobs who are doubling down on Dubya.


Recent Comments