Forgive Others as You Would Want to Be Forgiven
Here’s a quick one for you: Think through all the really obnoxious things you’ve done in your past. If you’re like me, most of them were because you were trying to impress people and/or compensate for some insecurity you had. Looking at your behavior objectively, you now could say, “Yes, I agree that that guy [girl] looks like a real jerk, but I know what I was worried about at the time, and that came off way worse than I meant it. If people who saw that behavior could know the full story, they would have a much better opinion of me.”
OK, now that you’ve finished that exercise, think about all the people you can’t stand because they act like such jerks.
Structural versus Demand-Side Theories of Unemployment
Paul Krugman has a new post–which Scott Sumner calls “very good”–in which he explains why the structural explanations of the recession don’t fit the facts. In contrast (you will not be surprised to hear), Krugman’s own demand-side theory comes out with flying colors. Here’s Krugman:
[O]ne strong indicator that the problem isn’t structural is that as the economy has (partially) recovered, the recovery has tended to be fastest in precisely the same regions and occupations that were initially hit hardest. Goldman Sachs (no link) looks at unemployment in the “sand states” that had the biggest housing bubbles versus the rest of the country; it looks like this:
So the states that took the biggest hit have recovered faster than the rest of the country, which is what you’d expect if it was all cycle, not structural change.
Now this is very interesting. I recall Krugman back in December 2008 making fun of the “structural unemployment” theorists by writing:
One striking fact, which I’ve already written about, is that the current slump is affecting some non-housing-bubble states as or more severely as the epicenters of the bubble. Here’s a convenient table from the BLS, ranking states by the rise in unemployment over the past year. Unemployment is up everywhere. And while the centers of the bubble, Florida and California, are high in the rankings, so are Georgia, Alabama, and the Carolinas.
Now even at that time, Krugman’s analysis was goofy. I pointed out that looking at year-over-year changes in unemployment at the end of 2008 was hardly the right test. If we looked at changes from the moment the housing bubble burst, then five of the six states with the biggest housing declines were also in the list of the six states with the biggest increases in unemployment.
So let’s review: Back when Krugman thought that the data showed no obvious connection between the collapse in the housing bubble and unemployment rates, he was happy to say that the structuralists were wrong, and only his generic demand-side story made sense.
Now, four and a half years later, Krugman readily admits that unemployment shot up more in the housing bubble “sand states” than in the rest of the country when the recession first struck. But because unemployment has fallen more sharply in these states amidst the recovery, he tells us that this is just what his demand-side story would predict. The structuralists, he tells us, can’t explain it.
That seems a bit convenient to me. One almost gets the sense that Krugman first looks at the data and then decides what his demand-side story predicts.
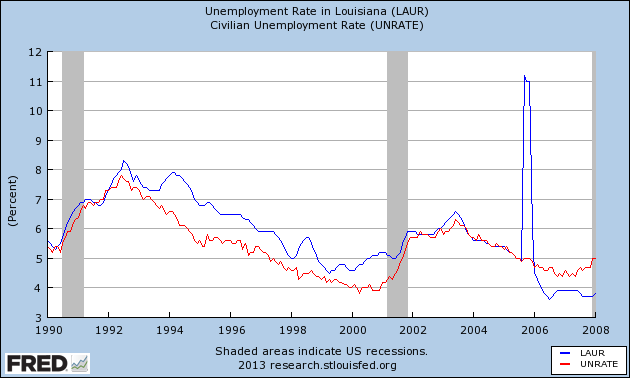
In any event, let’s apply this new, smashing argument against the structuralists to an earlier U.S. recession. Does everyone remember the downturn in the labor market of late 2005? Let’s go to FRED to refresh our memories:

As you can see, both the national and the Louisiana unemployment rates increased in late 2005. Now some of us Austrian and Real Business Cycle theory types wanted to blame it on a supply-side, structural problem–would this count?–that interfered with workers, employers, and consumers being able to interact with each other as smoothly as in 2004.
However, it’s obvious from the chart above that the state hit hardest by the shock was also the one to recover the most quickly. Thus, as Krugman and Sumner tell us, this is quite compelling evidence that people in the US in late 2005 for some reason decided to stop spending enough money, and moreover they must have been really antsy about buying things made in Louisiana.
Employment Ratios: Total, Men, and Women
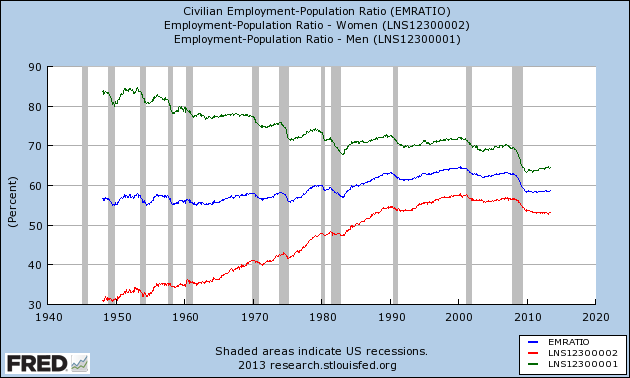
Tyler Cowen and Scott Sumner are debating over the significance of the sharp decline in the employment ratio (which looks at what percentage of the working-age population is employed, and is a different indicator from the labor force which considers the percentage of those actively seeking employment).
Although someone brought it up in his comments, Scott didn’t deal with what is clearly one of the huge drivers of the total ratio over the last 50 years: women entering the work force. When you decompose it by sex (red=women, green=men, blue=total), it sure does look like the economy is broken:

David Friedman versus Me
(I’m never sure whether to refer to myself in the 3rd person on posts like this. I’ve got to do what is best for Bob Murphy, even if it sounds weird.)
Here’s the debate we had at Porcfest in June. The only major miscommunication is that Friedman just wanted to talk about methodology, whereas I, the moderator, and the Porcfest event brochure all thought we were talking about the ethical foundations of anarcho-capitalism as well.
Also, if you’re too busy to watch this, I draw your attention to 11:20 – 12:20, where I correct the woeful deficiency in attention that the economics profession has given to Pat Murphy.
A Proposed Apology
[UPDATE: Some people got it in the comments, but just to be sure: This “apology” was a joke; I was just mimicking Krugman’s pseudo-apology in this piece. So if you knew right away that Krugman would never accept the below from Schiff or me, then do what you will with his own mea culpa…]
At this point, we could generate Paul Krugman’s blog posts with a gerbil, 3 index cards, and some twine. All you really need to write is, “The other side made bad predictions. They haven’t changed their policy recommendations. They are stupid, evil, or both. Winning.”
So I wonder if Krugman would move on with his life, if guys like Peter Schiff and me announced the following mea culpa:
[HYPOTHETICAL ADMISSION OF ERROR.] Yes, I made a mistake back in 2008, over Bernanke’s use of the financial crisis to push through a huge bailout of Wall Street, even though the arguments used to justify this “rescue” made no sense. The Fed started paying interest on excess reserves, at the same time they told the public its huge balance sheet expansion was all about maintaining lending to small business. This struck me at the time as banana-republic behavior, and still does.
However, I wrongly believed that markets would look at it the same way, and that they would lose faith in the Fed’s commitment to low inflation, driving up interest rates on our debt. Instead, bond investors discounted the cronyism, and acted as if they believed that the Fed would eventually pull itself together and start behaving responsibly. The jury’s still out on that, but clearly my short-run prediction proved wrong.
I have two questions for my readers:
(1) Does anyone think Paul Krugman would agree that the above was a candid acceptance of our mistake, and drop the subject?
(2) Does anyone know why I worded the above, the way I did?
Private / Government Components of GDP Bask
I want to look at the official GDP stats of the last 10 years and show the breakdown of private/government components of GDP. I went to the FRED website and took Government Consumption Expenditures plus Government Investment to be “Government GDP,” then took the difference between total GDP and that number, to be “Private GDP.” Then I adjusted these nominal figures by the GDP deflator to put them in real (2009) dollars.
Does anybody have a problem with this procedure? I don’t want to write up a big post and make a YouTube video on the results if people are going to claim that’s not the right way to do it. (If you’re curious why I don’t just grab the BEA’s official “Private GDP” series, it’s because I don’t think they exist. They have “Gross Private Domestic Investment” but I don’t think they have “Gross Private Domestic Consumption,” but I’d be happy to be corrected.)
My Position on the Current State of the Economy
I have neither the time nor the stamina to continue with the arguments in the comments of my last post. So let me clarify my position in case anyone cares:
1) Right now we are in the midst of the Great Recession, or the Second Great Depression if you prefer, in the same way that Americans in 1936 were still in the Great Depression. Notice how all of the things you guys are using to ridicule Schiff and me, could have likewise been used to ridicule someone in 1936 saying, “The economy is awful, all of these interventions are making it worse, we are still in a depression.”
2) Suppose there were an economy that initially had a GDP of $1 trillion and an unemployment rate of 5%. Then a year later GDP was down to $100 million, and the unemployment rate had shot up to 90%. The following quarter, annualized GDP was $101 million (which consisted of $50 million in private output and $51 million that the government spends on a single laser gun that the Pentagon assures us will fend off [nonexistent] alien invaders), while the unemployment rate had declined to 85%. According to some of you, not only is that economy now out of the recession, but anybody who said, “This economy is awful, we’re still in a recession” deserves to be mocked.
Does that strike anyone else as weird?
Questioning the Government’s GDP Numbers
Scott Sumner responded to my post on him vs. Schiff by saying he hoped I was joking.
No, I’m not. I actually think it’s weird that so many right-wingers endorse Scott’s argument. (To remind you, Scott argues that if price inflation were a lot higher than the government’s numbers, that would mean the economy is doing much worse than is plausible.) For what it’s worth, Scott doesn’t just take the BLS’ word over the experience of average Americans; he also trusts the Chinese government’s numbers over the perceptions of the people.
OK, let’s step back for a second and think about this. In recent years, the government run an annual deficit that hit 10% of GDP (the highest since World War II). The Fed took over AIG and engaged in what Jeff Hummel calls “central planning” by intervening in specific asset markets (while tripling its balance sheet). We had a huge move toward government takeover of the health insurance sector. The Treasury literally took ownership (some argue effectively at gunpoint) of major banks. They also bailed out the Detroit automakers. There are currently proposals floating around to institute a several trillion dollar (scored over the first decade) carbon tax, i.e. tax on energy (given current infrastructure).
So: If all of the above just causes some sluggish growth in the economy, such that Peter Schiff doesn’t even pass the “laugh test” for suggesting we’re still in a bad recession, then why the heck are so many of us interested in free-market economics? It clearly doesn’t make that much of a difference, right?
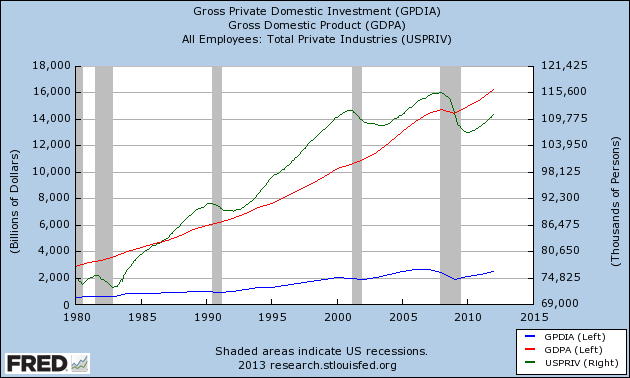
Try this. The chart below looks at the official total GDP number (red), versus the private domestic investment component (blue). Although the former is easily at an all-time high, the latter hasn’t exceeded 2007 levels (just eyeballing it).

The other line (right hand axis, green) shows total nonfarm private employment; this is the total absolute figure, i.e. bodies, not adjusted for population growth or anything like that. Just eyeballing it, it’s currently lower than in the late 1990s.
So you tell me: Is it really that outlandish–such that we just guffaw and don’t even bother responding–when someone says that maybe the government’s official numbers are understating how bad the economy is?


Recent Comments