Step #3 In My Dispute With Beckworth: Moving From Davie on Interest Rates to David on Interest Rates
First, a recap:
==> In Step #1 I made the obvious point that if an employer in late October says that the paycheck will be $1000 higher in November than previously expected, and the paycheck in December will be $700 higher than previously expected, that clearly this is a more generous policy, relative to the path expected the moment before the announcement. The fact that workers now expect a $300 pay cut in December, relative to November, is misleading and irrelevant. What matters is that the workers are getting more money in each month relative to the original baseline. The month-to-month movements in the new path per se aren’t important when deciding whether the information indicates a “looser” vs. “tighter” pay policy. Nobody gave me any argument here.
==> In Step #2, we tweaked the example so it was dealing with the employer’s interest rate policy, rather than paychecks. By analogy with wages, I argued that the important issue was whether interest rates were lower than the originally expected level in each unit of time (either month or the year as a whole). The fact that workers might expect interest rates to rise more quickly later in the year is misleading and irrelevant. What matters is that the workers are paying lower interest rates in each month (or year for the whole) relative to the original baseline.
After some clarification, again, nobody gave me any argument here, in the hypothetical scenario as I constructed it. To be sure, David R. Henderson was getting ready to say that interest rates aren’t a good indicator of monetary policy, but even he conceded that *if* we are going to say “lower interest rates means looser money” and “higher rates means tighter money” then the correct baseline is to look at the originally expected path. It is clearly nonsensical to merely look at the change down the road, if that change still puts us at a lower interest rate. That would be analogous to our Step #1, when Davie argued that the $300 wage cut in December meant he was poorer, even though he actually was making $700 more than he originally expected.
==> Now we are finally at Step #3. (And sorry for the delay, I got sick during my holiday traveling and missed a window when I thought I’d knock out this post.) I am going to argue that David Beckworth in the real world has made a mistake very similar to what Davie in Step #2 committed.
Specifically, Beckworth back on December 10 made two empirical arguments to defend Ted Cruz’s claim that the Fed tightened monetary policy in the summer of 2008. In this post (Step #3), I will tackle the first of Beckworth’s empirical arguments. In the final Step #4, I will tackle Beckworth’s second empirical argument.
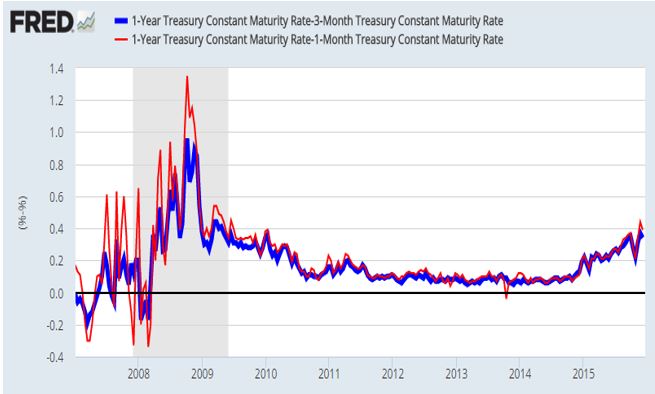
Now then, Beckworth’s first piece of evidence involved the following text and graph:
The [figure below] shows the 1-year treasury interest rate minus the 1-month treasury interest rate. Standard interest rate theory tells us that this spread equals the expected average short-term rate over the next year. That is, if the spread goes up in value then the market is expecting the short-term treasury rate to rise over the next year and vice versa. This figure shows a sustained surge in the expected short-term interest rate over the next year from April to November 2008. It especially intensifies in the second half of the year. Only in December does the spread really begin to fall. For most of the year, then, the market increasingly expected a tightening of policy going forward.
Now does everyone see how that is exactly analogous to Davie’s argument in my hypothetical scenario in Step #2? Specifically, Beckworth has shown–correctly–that the future increase in short-term rates expected by the market went up sharply during the fall of 2008. (It’s not as clear to me what happened before the fall, since the lines bounce violently up and down.) Beckworth seems to believe that his demonstration was the same thing as demonstrating that the market expected higher short-term rates later in the year, compared to the originally expected path.
But we know that in general, those two claims are not equivalent. That was the whole point of my (obviously contrived) scenario in Step #2; I wanted to make it crystal clear that in principle, those two things are not equivalent. If you have lost me here, I urge you to go back to Step #2 and look at the two graphics boxes, and see the distinction. Specifically, the market can simultaneously (A) expect rates to increase more during the year than previously expected and (B) expect future short-term rates to be lower than previously expected.
How is this possible? Simple: If all expected short-term rates drop for the next year, but the closer ones drop more than the further distant ones. Then you get the result that (A) the market expects rates to climb more during the year than it expected as of yesterday and (B) the market expects rates in, say, 8 months to be lower than it expected as of yesterday.
So why do I think that in the real world, this is what happened with Beckworth’s numbers? Well, in the chart below I decompose the spread. That is, I show not just the spread between the 1-year and 1-month Treasury bill yields–which is the red line in Beckworth’s chart above–but I also show the actual values of the 1-year and the 1-month yields:
However, my FRED chart has more information than Beckworth’s. In particular, the spike in the green line in September occurred because short-rates dropped (my red line) sharply, while one-year rates (my blue line) only dropped modestly. So since one-month rates collapsed while one-year rates fell more gently, I think this is similar to what happened in my contrived Step #2 example. Yes, the spread widened and we can interpret that as saying, “As of September 2008, the market expected one-month rates to rise more rapidly over the next 12 months than the market expected as of August 2008,” but that’s not the same thing as saying, “As of September 2008, the market expected the one-month Treasury yield in August 2009 to be higher than the market expected as of August 2008.”
==> In my Step #4–the final in this series–I’ll deal with Beckworth’s second empirical argument, and in so doing I will also shore up my position for this Step #3. Specifically, we will look at futures contracts to back out actual implied market forecasts of certain types of short-term rates in future months, at various points along 2008.
==> Last point for purists: Even my FRED graph is consistent with the claim that the Fed led markets to believe it would tighten and/or was actually tightening, from about March 2008 through June 2008. (That’s because the blue and red lines are both rising during this period, meaning that short rates were rising and the market thought future short rates would follow suit.) But that pattern turned around in June, when the blue line began its gradual fall for the rest of the year. So this is the exact opposite of what Ted Cruz needs for his version of history to make sense. In other words, if you want to argue that the Fed was giving winks to the markets to lead them to think tighter policy was in the works from March to June 2008, but then in June the Fed said, “Ha ha fooled you, actually we’re loosening,” then my FRED chart is consistent with that narrative. Yet that’s the exact opposite of what Cruz said happened, and thus the opposite of what David Beckworth said he was explaining with the Treasury yield curve data.


“So this is the exact opposite of what Ted Cruz needs for his version of history to make sense. In other words, if you want to argue that the Fed was giving winks to the markets to lead them to think tighter policy was in the works from March to June 2008, but then in June the Fed said, “Ha ha fooled you, actually we’re loosening,” then my FRED chart is consistent with that narrative.”
-Tight money is consistent with lower interest rates (real and nominal). Interest rates aren’t an indicator of the stance of monetary policy at all, they’re just a tool of monetary policy. Look at TIPS spreads for a more realistic measure of borrowing costs (which aren’t monetary policy, but are better correlated with it than short-term nominal rates) than nominal treasury rates:
https://research.stlouisfed.org/fred2/series/DFII5
Governments wanted to abandon the use of gold coins because tight money is *not* consistent with lower interest rates.
Interest rates on the most safe assets collapsed during the Great Depression. Money was tight; interest rates were low.
Rates on borrowing money are the relevant rates, not on the previously malinvested assets people were willing to sell at a discount in order to feed themselves.
Here’s the logic of the lower interest on assets:
Gonzalo Lira: What Hyperinflation Will Look Like In America
http://www.businessinsider.com/gonzalo-lira-what-hyperinflation-will-look-like-2010-9
“One of the effects of Chile’s hyperinflation was the collapse in asset prices.
“This would seem counterintuitive. After all, if the prices of consumer goods and basic staples are rising in a hyperinflationary environment, then asset prices should rise as well—right? Equities should rise in price—since more money is chasing after the same number of stock. Real estate prices should rise also—and for the same reason. Right?
“Actually, wrong—and for a simple reason: Once basic necessities are unmet, and remain unmet for a sustained period of time, any asset will be willingly and instantly sacrificed, in order to meet that basic need.
“To put it in simple terms: If you were dying of thirst in the middle of the desert, would you give up your family heirloom diamonds, in exchange for a gallon of water? The answer is obvious—yes. You would sacrifice anything and everyting—instantly—in order to meet your basic needs, or those of your family.”
The market was correcting (tightening) the Fed’s loose monetary policy by discounting the value of the FRN.
You do know the Great Depression was deflationary, right?
Implying that real interest rates were significantly higher than nominal interest rates.
https://en.wikipedia.org/wiki/Fisher_equation
“Tight money is consistent with lower interest rates…”
If you are referring to the theory ofrates according to Sumner, then that comment is not accurate enough. No, it is not enough to say they are consistent. You have to also take into account timings.
Low rates, according to Sumner, are not consistent with tight money at the moment, but rather, with past monetary policy that was tight (he still has not defined how much in the past, but it is likely whatever time frame allows for a correlation of rates and NGDP). In the moment, he believes lower rates are consistent with loose money.
Sumner and I say that low interest rates are consistent with both previously and presently tight money.
Ah, the ol’ “consistent with.”
Having one’s cake and eating it too, I guess.
Actually, Sumner has on multiple occasions specifically separated the effects of past and current tight money on interest rates by saying low rates are a result of past tight money and that the liquidity effect from current monetary easing lowers interest rates.
It s why he keeps quoting Friedman. Money “has been tight.” He emphasizes the “has been” part.
Source:
http://econlog.econlib.org/archives/2014/11/youve_got_the_w.html
Bob Murphy is right about what an ingrate you are EH. Here he provides you with bad arguments free gratis, and you bitch.
What’s your deal? You constantly kick sand in the face of Murphy until he bans you from the site, then periodically come back under some different name only to immediately start kicking sand in his face again. Is that just your thing, being extremely abrasive online?
Also, markets expected NGDP growth to be higher than what panned out. That affected their interest rate expectations.
Bond traders don’t take NGDP into account. They take prices, risk, liquidity, and time preference into account.
And NGDP is a major factor in all of them.
According to you, sure. But that isn’t what you said. You said the market had NGDP expectations and took that into account in their pricing.
That’s like me claiming the market took into account human breathing trends and patterns when they priced bonds, and then when you rebut that and say the market did not, I double down and say “breathing is indirectly related to all those variables, so there.”
In other words, you are not actually arguing the market took NGDP expectations into account. You are making your own theoretical assertion and presuming that your theory is what bond traders have in mind when they price bonds.
In actual pricing, bond traders largely ignore NGDP. I suppose there might be some small group of bond traders that use pricing models that include NGDP as an independent variable, but even so, that is a far cry from laying claim that interest rates in the market changed one way or the other because of NGDP expectations. How many textbooks or economics papers include any bond pricing models with NGDP as an independent variable? These sources are what teaches future generations of bond traders.
LOL – this response is perfect.
I’m at the stage of trying to understand your argument and I have a clarifying question:
In his initial post Beckworth says his chart shows there was a “a sustained surge in the expected short-term interest rate over the next year from April to November 2008.” .
Are you saying that this claim is factually wrong ? That his chart (when shown in more detail) does not in fact show a surge in the expected short-term interest rates until much later than April. Before then it just bounces around (Goes up in April, down in May, up again in June, down thru mid-august, gently up till September, when rates really fell, and the line shoots up).
Transformer:
If Beckworth is claiming that the market thought short-term rates would rise more during the next 12 months than it had previously thought, as time passed during 2008, then I think it is a correct statement but a non sequitur. Just like Davie in Step #2 correctly said that the spread had increased, and that the jump in short-term rates in July increased, but that neither fact meant the employer had tightened credit policy.
If Beckworth is saying that the market thought short-term rates in the near future would be higher than the market previously thought, through 2008, then I am claiming he is wrong.
The reason I can’t give you a definitive answer is that I believe Beckworth was using those two statements interchangeably.
Of course ultimately if you define “tightened credit policy” as the policy that maintains NGDP on trend then even if Beckworth concedes that that chart is ambiguous he can claim that the fed tightened in 2008 by failing to cut rates by more and sooner (and caused the subsequent NGDP nose-dive) and that therefore Cruz is still correct.
” that maintains NGDP on trend ” should be “that FAILS to maintains NGDP on trend”
Is that how Beckworth defines that?
Yes, I believe so – at least that is a rough approximation of market Monetarist views.
The problem with the contrived analogies is that they carry the hidden assumption that Bobbie and Davie had constant demands for bonuses or loans and their expectations were based on those constant demands. If their employer had a stated policy that it would accommodate any increased demands for bonuses or loans with lower rates or bigger bonuses and Bobbie’s and Davie’s demands were increasing month to month then both could well regard the $700 Dec.bonus as a tighter policy. They also could easily regard the overall lower loan rates in the second year as tight loan policy as long as their demands for loans had increased substantially from one year to the next.
As for Beckworth, yes he opened the door to “let’s look at rates to determine the stance of monetary policy” even while Sumner has been nagging us for years that rates are a poor indicator on the stance of policy. But, he at least attempted to limit using rates to identifying the expected change in policy and not for determining the stance.
Bob, doe the Austrian view on interst rates includes risk in top of time preference?
I always see Austrians discussing interstate rates as a time preference issue and never a thing about risk.
I seem to recall that for Austrians the reward for risk is called profit, not interest. Interest is only about time preference. Profit is about risk.
Thanks Mau, do you or anyone have a link to any Austrian treating this subject of interest rate not just as time preference.
George Reisman devoted an entire chapter in his book on a theory of profit and interest.
Robert Murphy wrote his PhD thesis on interest rates.
Both do not accept the pure time preference theory as is. Reisman treats the pure time preference theory as a special case but still the ultimate driver, whereas Murphy critiques it to the point of abandoning it.
Hang on, I think every Austrian accepts that more than merely time preference is at work here. If you were offered to invest 1 dollar now and get a million dollars next week you would probably give it a go, right? So the preference is always for higher return… if that’s an available option.
On the other hand, such a great deal might not be on offer, so you settle for a weaker deal. Your preference is still for the greatest return, but you accept the lesser option. At some point (as the offer of future returns gets worse and worse) there comes a point where you give up and just spend the money on consumption right now.
Already we have two opposing factors in play:
* what people want, and
* what is realistically available to them.
On the margin (presuming no government interference) we have a meeting between the person trying to save who is lowest in the interest rate return that he/she will accept before giving up and spending the money immediately, and also the investment opportunity that can satisfy the highest rate of return amongst those available investments that are possible.
BOTH of the criteria must be satisfied. Personal time preference is one side of the equation, and also achievable investment opportunity is the other side of the equation. There’s always two sides.
“… and also achievable investment opportunity is the other side of the equation.”
Which he assesses as X amount, and then bases his decision on whether or not to invest on X.
The time preference is for X.
The pure time preference theory of interest holds.
Well, a higher interest rate is moot if you never get your money back, so I don’t think risk, per se, is a factor in the amount of interest.
Maybe you expect to lose money when borrowing in the future, so you charge a higher rate to create a safety net for yourself, but even then there’s an expected level of loss that’s factored into the higher rate and, to the extent it’s expected, it’s not risk, per se, that accounts for the higher rate.
You charge a rate of interest between the amount of money that could have bought you the utility you’re foregoing while it’s lent out, and the amount that could have bought the utility the borrower expects to gain in the future.
Both parties will try to maximize their profit because there’s no point in foregoing profit – even if that profit is only psychic profit. (“Profit” is simply a state of being that is better than what would have obtained if an action had not been undertaken.)
Maybe these will help:
Basic Economics Lesson 4 – Time Preference, Interest Rates, and Production
[www]http://www.youtube.com/watch?v=g2OK5D_3TzM
Praxeology – Episode 8 – Time
[www]http://www.youtube.com/watch?v=RcjEn-u8s80
Praxeology – Episode 9 – Uncertainty
[www]http://www.youtube.com/watch?v=d_i3WOeqqzQ
Blogger, the Fed tightened in late 2007 when it saw LIBOR exploding and did nothing. The absence of necessary loosening was tightening. The Fed essentially froze from then until IOR and IOR was further tightening. The Fed could care less about the economy when its big banks are in trouble. That is my take.