Bursting Erdmann’s Bubble
[EDIT: I’ve added Erdmann’s second graph below.]
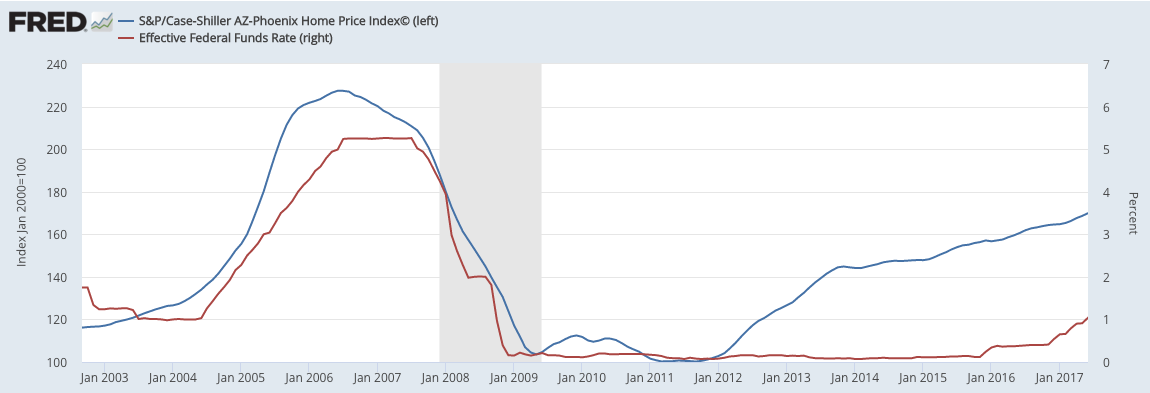
In a previous post I was talking about Austrian business cycle theory and the housing bubble. Kevin Erdmann thought he blew us up by posting these two charts:
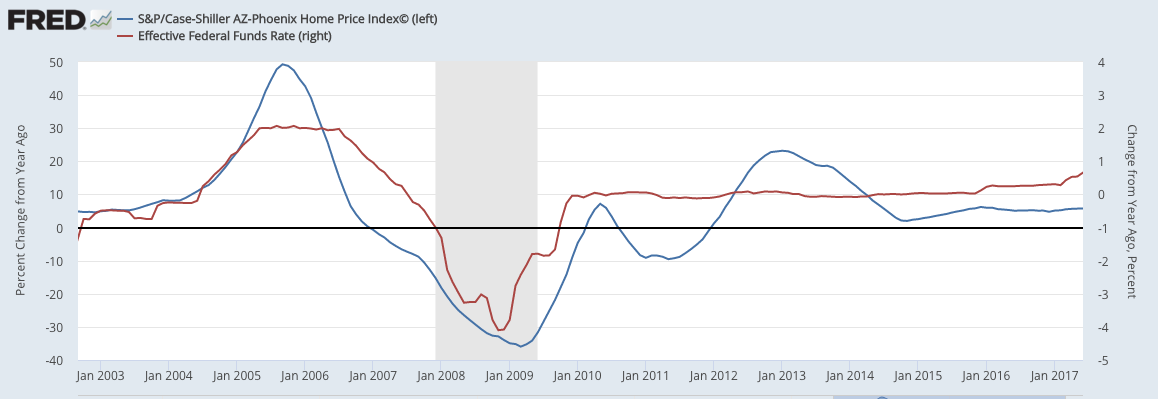
and
Erdmann asked, “Would anyone care to make an ABC interpretation of those two graphs? Did low rates cause the bubble in Phoenix?”
Everyone see why he thinks it’s a mic drop? It looks like the Phoenix housing bubble followed rates up and then down, i.e. the exact opposite of the Austrian story.
But of course, Erdmann is conveniently starting his chart when the housing bubble really kicks in. If you take a longer view, you see this:
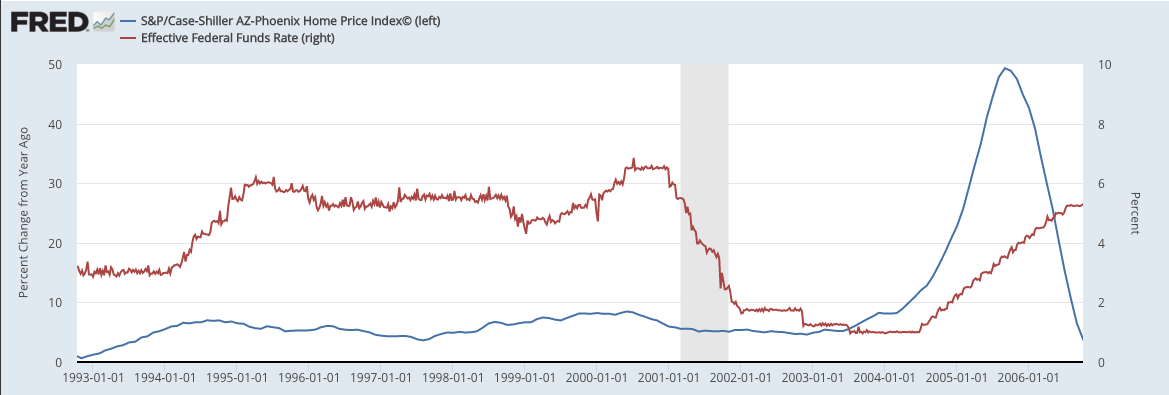
And yes, that looks consistent with the claim that it was unprecedentedly low interest rates that sparked the bubble, and then when policymakers began raising rates, they pricked the bubble.


Top and bottom do not show the same things. Blue line in top graph is the price index itself, while blue line in the bottom graph is the first derivative w.r.t. time of said price index.
I saw the phase shift by 90 degrees in the first two seconds, but then sat for the next 10 minutes squinting at the fine print trying to figure out what was causing that. I’ll take this to be one of those challenges to see who’s still sharp.
Oh sorry Tel. Erdmann gave % change in his second graph.
Bob, since Tel seems to have a problem with the graph that you created, maybe you could clear things up by putting my graph in the post, which compares YOY changes of home prices and the Fed Funds Rate.
I was looking at the same thing – the second graph is about to go very negative as the slope becomes downward – is that right? So the peak of the graph is the inflection point on the upward slope?
Foiled.
The concept of the natural rate eludes area monetarist.
Oops. The following comment was a reply to Andrew_FL
The popcorn I am chomping on is especially scrumptious since the very post I commented on included a complaint that a flexible counterfactual allowed Scott Sumner to have it both ways.
If you interpret these graphs to mean that the neutral rate was around 1% in 2003 and around 0% in 2009, and around 4-5% in 2007 then I heartily salute you, sir. Just because a counterfactual is flexible, doesn’t mean it isn’t true. I’m right there with you.
It’s almost as if disputes about the meaning of economic history require reference to economic theory and cannot be settled empirically as such.
Kevin wrote: “The popcorn I am chomping on is especially scrumptious since the very post I commented on included a complaint that a flexible counterfactual allowed Scott Sumner to have it both ways.”
Can you spell things out a bit more? I think you’re saying something like this: “Bob was complaining that Sumner sneakily used a convenient counterfactual to make his point, when Bob claimed he could just as easily demonstrate the opposite conclusion with a different counterfactual. Well it’s kinda ironic that Bob’s own approach means that a 1% fed funds rate is consistent with either home prices skyrocketing or collapsing, depending on what’s necessary for his story to work.”
Am I warm?
I may have caused some confusion. That comment was meant to be a reply to Andrew_FL.
Sorry for the multiple comments, Bob. But, I have a moving scatterplot of home prices by zip code that I think really helps to see various moving prices over the course of the boom and bust, in case any readers here are interested. I really like how the moving graph turned out.
http://idiosyncraticwhisk.blogspot.com/2017/06/housing-part-238-home-price-changes.html
Gives the illusion of a rotating object.
Erdman’s second graph is derivative of both parameters, your graph is derivative of price and actual rate. Is this reasonable?
Harold, to me it is. I think most people have in mind the idea that “low interest rates cause asset price appreciation and high rates cause asset price drops,” not “the rate of change of interest rates is inversely related to the rate of change of asset prices.”
There was an article going around awhile back making the case that speculators/investors (and not sub-prime) borrowers were what drove the boom & bust.
I do not have a problem with the idea that borrowing patterns etc, did not change much among sub-prime type borrowers, it was the wealthier tier of prime-borrowing investors that were doing the bidding up of prices, etc. But it kind of begs the question — why were they doing it? Why doesn’t it happen all the time, etc,/ why was the market ever out of equilibrium? The speculators might be the ‘pushers’, but where does the energy of the ‘push’ come from?
Seems like the better argument is suppressed interest rates. I like the analogy to a chemical reaction — the speculators are like catalysts, but the energy that drives the reaction is bound up in the thermodynamics of the system, to which the catalyst is irrelevant. Catalysts just get you to the end point faster. If you do something like, say, wrap a big hunk of plutonium in TNT, every thing can still be fine, perfectly safe. But introduce a blow-torch into the picture, and suddenly it isn’t. But it doesn’t really make sense to blame the blowtorch for the explosion. I can have a blowtorch in an empty room, or a room full of sand and water and other un-energetic materials, and nothing really bad will happen.
People have really different discount rates, and when mortgage rates dropped as far as they did, I think a lot of people looked at housing and said “sure, I’ll take that over what I think I can get in the stock market. I think I’ll become a landlord.” In some ways, many of them may feel driven to it because the rate of discount in those other markets has gotten so low, driven there by even bigger fish who are okay with really lean returns, and higher discount assets they wouldn’t normally consider looked enticing. But sub-prime type borrowers, who are buying for a completely different reason, are not going to apply such a discount or see a similar trade-off involved, they just see prices going up on the houses they want to live in, and so probably are more or less just bystanders being driven out of the market (or marginalized within it, anyway) by the speculators.
In general, I think that very different discount rates among different market participants drives a lot of the social-political-economic angst that we see. I’m not sure there’s a whole lot anyone can do about that, we’re all just different and we all have to live together. But I don’t think the financial system is helping the situation much.
“But it kind of begs the question — why were they doing it? Why doesn’t it happen all the time, etc,/ why was the market ever out of equilibrium? The speculators might be the ‘pushers’, but where does the energy of the ‘push’ come from? …”
“… In general, I think that very different discount rates among different market participants drives a lot of the social-political-economic angst that we see. I’m not sure there’s a whole lot anyone can do about that, we’re all just different and we all have to live together.”
Austrians would see the “different discount rates among different market participants” as the “blowtorch”, and the financial system (as currently structured) as the TNT-wrapped plutonium.
Consumers have to want what producers are making, otherwise that producer will go out of business. That’s true in any configuration of the economy, including recessions/depressions. That’s why we say that “lack of aggregate demand” can never, logically, be the cause of crashes, recessions, etc.
The same is true of individuals’ propensities to save, and their resulting discount rates.
Left alone, the market produces prices and rates that tend to conform to consumer demand and, thus, to sustainable production processes.
What the Austrians say is that printing fraudulent paper claims to goods does not directly increase the amount of goods/materials in the economy, but it does redistribute wealth from those holding older money to those who can spend newer money before everyone else.
This is what creates the mismatch between demand and production. In a crash, producers find they have stuff that won’t sell. The reason isn’t because consumers are demanding the “wrong” things, and they should be spending to help the economy; Rather, it’s because they’ve been producing the wrong things the whole time, as a consequence of the artificially low interest rates resulting from printed money.
Stop the money-printing, and any mistakes made by producers will be caught way before it can become a systemic problem, because the banks won’t be able to lend what they don’t have, and therefore they won’t be capable of artificially lowering interest rates.
It’s true that, under a gold coin standard, redistribution would also occur as a result of the introduction of new gold coins, but since gold, itself, is a good, new gold coins would be both an increase in money units *as well as* an increase in goods.
And so such a redistribution would be justified because new gold coin holders would be bringing more of something that has actual use-value into the economy.
Here’s Los Angeles for comparison, by the way.
https://fred.stlouisfed.org/graph/?g=feRT