30
Jun
2017
Potpourri
==> LAST CHANCE! Remember there’s a great discount for my student text and teacher’s manual of Lessons for the Young Economist. Offer expires today (June 30, 2017).
==> You know, people like Krugman criticize me for refusing to grapple with the surprising inflation results after 2008. It’s like he never saw the publication:
Murphy, Robert. (2014) “Explaining Inflation in the Aftermath of the Great Recession,” Journal of Macroeconomics, Vol. 40, pp. 228-244.
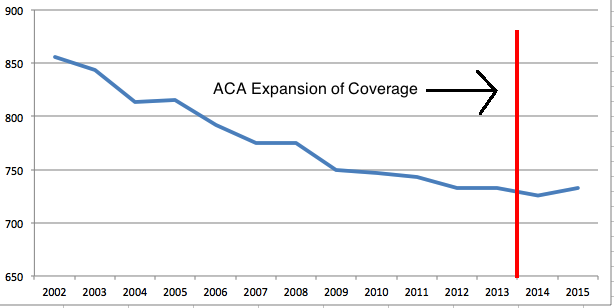
==> My latest explaining the case against ObamaCare “saving tens of thousands of lives annually.” I rely heavily on Oren Cass’s original research, but one of my contributions is to actually chart the mortality data:
U.S. Age-Adjusted Mortality Rates per 100,000 (Annual, 2002–2015)
Source: CDC WONDER Database


Good to see you giving a signal boost to Cass’s study!
Why did you change your middle initial?
That’s the joke.
http://www.bc.edu/schools/cas/economics/faculty-and-staff/faculty-listing/robert-murphy.html
The hair grew back!
Yes, Darien, I was making that joke as well.
“The researchers looked at mortality rates, but they could not reach any conclusions because of the extremely low death rate of the general population of able-bodied Oregon adults aged 19 to 64”
It is important to know the resolving power of the study. If Obamacare were to save “tens of thousands” of lives over the whole USA, would we expect study of this power to spot it?
I presume not, from the quote from wikipedia. Whilst you have been careful and correct in your conclusions, some of the other headlines have not been quite as careful and possibly read a lot more into the study that it is capable of delivering.
In keeping with the topic of “Potpourri”, check out chart 3.23 here…
http://www.usgovernmentrevenue.com/revenue_history
We can discuss the interpretation of that, but to me what it says is that year 2000 was a fundamental turning point in terms of the US government ability to extract tax from the population. This includes all of government (Federal, State & Local) as compared with GDP. They basically hit the revenue wall.
In the past, whenever facing a problem, they simply found a way to tax people harder… but now they can’t do that any more. We are finally at the point where we face the problems, instead of sweeping them under more revenue. That explains a lot … I feel enlightened.
“For example, there is a festering opioid epidemic in many parts of the US, so perhaps it was just bad luck (for Obama’s legacy) that this public health crisis happened to hit right when his signature legislature fully kicked in.
Yet Cass points out that we still have a pretty good control group to assess the specific impact of the Affordable Care Act’s boost to coverage. Specifically, only 31 states (plus DC) expanded Medicaid under the ACA, while the other 19 states rejected the offer. So if it’s true that the ACA really did “save lives” relative to what otherwise would have happened, but that the absolute mortality rate in the US went up because of some external problem (like the opioid crisis), then we should still expect see mortality rates jumping more in the “red” states that rejected Medicaid expansion.
And yet, as Cass points out in his study, we see the exact opposite. Namely, the states that took advantage of ObamaCare’s Medicaid expansion saw a worse impact on their mortality rates than the states that rejected the expansion.”
Funnily enough, it actually appears that rather than being a confounding factor, Medicaid expansion has increased mortality rates by exacerbating the opiod crisis.