CPI in 2015 Highest on Record: Inflation Deniers Beware
David Kreutzer, an economist at the Heritage Foundation, is one of my favorite guys in the climate change debate. (I invited him to the IER conference on carbon tax that I organized.) Today he sent me his recent article in the Daily Signal reacting to the NOAA report that 2015 was the second-hottest US year on record (since 1895), a fact that produced obvious reactions from various carbon tax advocates.
Out of curiosity I clicked the links through to NOAA’s actual data set, and remarked to David that if we rank the years from 1895-2015 from hottest to coolest, then the top 5 years include 1998 and 1934, which is a bit odd if you think CO2 is the big driver.
That made me relate the issue to monetary and price inflation. Most economists would agree that the main driver for rising consumer prices is a rising quantity of money, especially over long stretches of time. It would be inconceivable that if you ranked the years 1895 through 2015 in terms of the level of prices (not the annual rate of price inflation, mind you, but the level), that two of “the most expensive” years would be 1998 and 1934.
At this point I really wanted to waste some time, so I decided to generate some graphs to illustrate my point. First let’s do monetary vs. price inflation. If we go from 1919 through 1992, it looks like this:
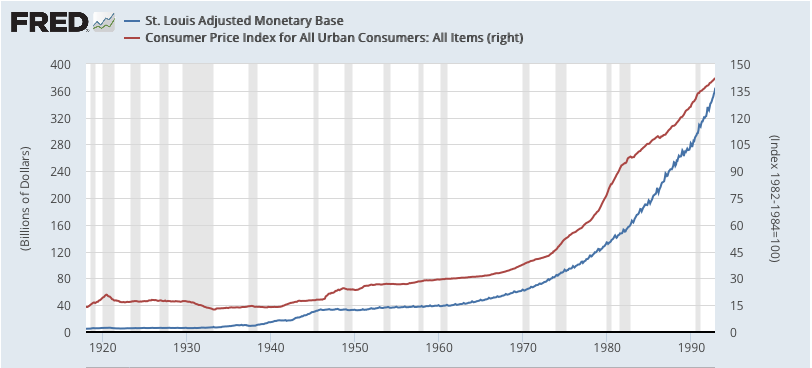
Note that in the above, I chose the monetary base (rather than M1, M2, or some other potential aggregate) because that’s the series FRED had furthest into the past.
It’s a pretty good fit, isn’t it? Of course, it’s not perfect, and if you calibrated a computer model with the above, you would’ve been caught flat-footed when the huge expansionary of the monetary base since 2008 didn’t generate comparable increases in CPI:
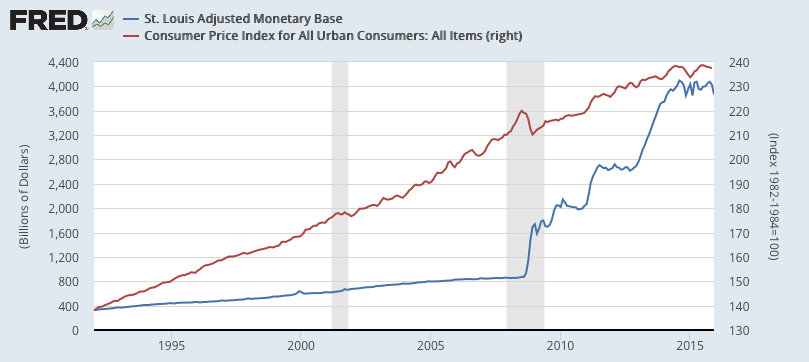
(Ideally I would have kept the tight fit of the two lines up through 1992, and then had the blue line explode upward while the red continues its gentle increase, but I couldn’t figure out how to make FRED do that.)
So, if we want to make an analogy with the climate debates, we could imagine some poor economists who had been warning of price inflation being perplexed by the above. They might speculate that the excess reserves went into the ocean, and would show up eventually in higher consumer prices. (That was Cliff Asness’ awesome tongue-in-cheek response to Krugman.) Yet even so, given the pretty tight correlation in the past, and the unusual nature of events since 2008–not to mention investors thinking that perhaps that monetary base will eventually be sucked out of the system–you can see why the inflation hawks would not think their worldview had been utterly smashed.
Let’s turn now to the issue of atmospheric carbon dioxide concentrations and (U.S.) temperatures. Here’s the chart relating the two, though I caution you that scientists only have direct observations of atmospheric CO2 from 1959. Prior to that, they estimate it using ice core samples. In any event, here you go:
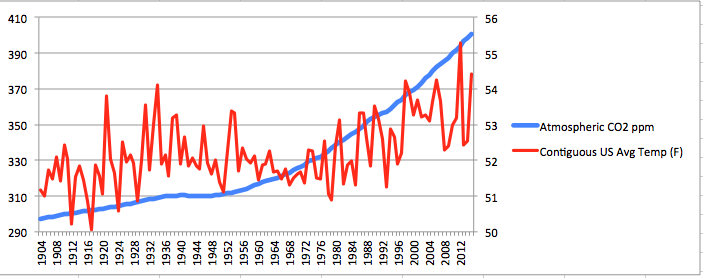
In case you’re wondering why I started at 1904, the answer is simple: Excel didn’t recognize it as a valid date if I went back to 1903.
Perhaps I’m biased, and you can try putting it in Kelvin to see if that changes things, but that doesn’t look like nearly the no-brainer connection as we had with money and CPI. For example, the U.S. average temperature in 2013 is about the same as it was in 1910, even though CO2 concentrations were up almost a third. Average temperature in the 1930s was 0.3 degrees higher than in the 1980s, even though average CO2 was 12 percent higher in the 1980s.
Before closing, let me reassure my scientifically literate readers that I have read lots of the IPCC material. I understand full well how a climate scientist who is alarmed about anthropogenic climate change would explain the above. But my point is that even though in the past I have whimsically made a comparison between people (like me) who warned of large consumer price increases and those (like Krugman) warning of large temperature increases, I think the people in my camp have been much more reasonable about it.


As I said the last time you pointed this out, this is a lame argument, as nobody thinks the absolute price level is important, while everyone thinks absolute temperature levels are.
“Of course, it’s not perfect, and if you calibrated a computer model with the above, you would’ve been caught flat-footed when the huge expansionary of the monetary base since 2008 didn’t generate comparable increases in CPI”
-Not if you thought the zero lower bound would lead to further increases in the monetary base resulting in no increase in bank lending except by directly affecting NGDP first. And that’s what happened. Both in 2008 and aftermath and during the Great Depression. When ZLB was hit, further increases in the monetary base failed to directly spur bank lending. Scott Sumner and Paul Krugman realized this. You didn’t.
https://research.stlouisfed.org/fred2/graph/?g=359m
If you redefine “inflation” to mean “increase in the money supply,” then it’s tautological that quantitative easing produces more inflation. That’s a pretty stupid thing to do, however. Not only is it intrinsically stupid, but it ignores the fact that “price inflation” is the only type of inflation anyone cares about.
One doesn’t have to “redefine” inflation as an increase in the money supply. That was indeed the original definition. It would just be a case of reverting to the original definition. And that’s not stupid by any stretch of imagination, definitely not intrinsically stupid. Calling it inflation and labelling price rise as price inflation is a very sensible and useful thing to do. It helps have 2 distinct but related names for cause and effect.
Further, since the effect of inflation (as originally defined) goes beyond an increase price to prices being higher than they would have been in the counterfactual universe and, when you dig deeper, to relative price changes or Cantillon effects, there is ample room to say that labelling money supply increases as inflation is economically very sensible. It helps you see how inflation one of the key promoters of the boom phase of the business cycle. It helps you understand why the boom is created in specific sectors and further highlights the effects of boom-phase inflation as the cause of the bust-phase or depression.
Finally, when you say “anyone”, it would be better to speak for just yourself. I, for one, am more bothered by money supply increases than by price changes because I know that they latter is just an effect of the former.
Joe Weisenthal Goes Total Idiot in an Attack on Austrians
http://www.economicpolicyjournal.com/2013/02/joe-weisenthal-goes-total-idiot-in.html
“Business Insider executive editor Joe Weisenthal has gone from just a gold-hater to being a bizarre clueless hater of the Austrian school.
“He tweets:
“People who call Austrian economics a cult often miss the most compelling evidence: That Austrians have invented their own language.
— Joseph Weisenthal (@TheStalwart) February 20, 2013
“Which is followed by this:
“For example, Austrians define inflation totally differently than real economists. mises.org/easier/I.asp#16
— Joseph Weisenthal (@TheStalwart) February 20, 2013”
Get Your Popcorn Ready: Joe Weisenthal Has Apologized to Mises…
[www]http://www.economicpolicyjournal.com/2013/02/get-your-popcorn-ready-joe-weisenthal.html
“As a follow up to my post, Joe Weisenthal Goes Total Idiot in an Attack on Austrians, Weisenthal has tweeted up a storm.
“So. Some Austrian economics bloggers are having a field day with me for what i said about the definition of inflation economicpolicyjournal.com/2013/02/joe-we…
— Joseph Weisenthal (@TheStalwart) February 21, 2013
“Then Joe tweets:
“I don’t know the history, but I might have been wrong about the pre-current definition of inflation. In which case I apologize to Mises…
— Joseph Weisenthal (@TheStalwart) February 21, 2013”
Lesson for Joseph: don’t try getting “old school” with the Austrian school, especially Mises. Also, the time spent learning your history can be very worthwhile.
Ms. Steele, serious question for you, I hope you respond. A response from anybody would be nice as this is a very serious question.
Assuming the market basket of prices used to calculate price inflation was only purchased by consumers who did not recognize a net revenue increase, could these prices increase?
Simply stated, in order to purchase a higher priced product, doesn’t consumer have to have more money?
I feel sorry for you guys. Who would be credulous enough to listen to these “Austrian” kooks–you know, the guys who have predicted 105 of the last 4 recessions–at this point? Murphy is a lazy charlatan who is making up his “economics” willy-nilly; you all are his cult.
The “Austrians” claim that their aversion to using data in their models is a principled epistemic position. But it’s just an excuse to be lazy. (Can you picture Murphy taking the time–away from his busy day job blogging about “economics,” Star Wars, and creationism–to crunch numbers?)
Eschewing data for superficially-plausible, moralistic “narrative economics” is also a good way of attracting laypeople (or “suckers,” as Murphy probably calls you) to Austrian economics, since laypeople lack the intelligence or education to understand real economics.
I just wonder why you bother coming here and wasting your time on us kooks and cultists. I am sure you have better things to do with your time like building new models based on more refined assumptions, making precise quantitative predictions about economic phenomena, gathering data to test your predictions, validate your mind-blowing models…. You know….. science….. I am sure you will find a wonderful model one day, one that incorporates precisely what’s on the mind of every human being on this planet and use that information to make unbelievably correct predictions about economic phenomena.
Please. Do move on and let us kooks and cultists be.
So you did not answer my simple question, probably because an honest answer would undermine your position on inflation.
Fact is, CPI has no increased much because the people who purchase the products contained within CPI, have no new money to spend, therefore preventing price contained within CPI to increase.
We are not BM cult members and Bob should really do a better job of explaining the government policy of inflation and explain that has been tremendous price increases, they just happen to be outside of CPI. I.E. stock market and vacation homes.
Bob never lost the bet, he made the wrong bet.
I feel sorry for you. CPI may be only recorded as 2% but CPI is a market basket of specific products. These products are purchased by a specific subset of consumers who have no new or extra income, therefore the customers could not pay the higher asking prices, thus preventing CPI increase. To understand true inflation( defined as price increase), one must look outside CPI. I.E. equity’s, vacation homes, etc.
You stick a tiny dot in the top corner to force the auto-scale to shift down, and then you try to pretend that green thing sticking out in the corner is no big deal. Something like this:
https://research.stlouisfed.org/fred2/graph/?g=35TP
How did you accomplish such wizardry Tel? For real, how did you “stick a tiny dot in the top corner”?
Note there are three items in the chart, data series 3 is a “Trend Line” which can be any four values you want to type in.
Also note I needed to swap left/right axis, because for some strange reason the “Trend Line” can only work on the left side axis (unless there’s something I missed).
When you click “Add Data Series” use the drop-down box under “FRED Series” to change to a “Trend Line” instead, then just type in some likely values.
It’s a kludge, but those trend lines can be useful for other stuff, so worth giving it a go.
Are stocks, Ferraris and vacation homes contained in the CPI?
Why did you use U.S. temps instead of global temps?
Josiah I was riffing off news stories that reported NOAA data on US temperatures as further evidence that we had to act now to stop catastrophic climate change.
It’s odd, Josiah. I told you in the beginning of the post exactly what happened. Are you emailing NOAA and Politico too?
I can hardly blame NOAA for releasing its data on U.S. temps. But for the analogy you’re making global temps seem more relevant.
Can you blame Bernie Sanders for saying this means we need action on climate?
Did Bernie Sanders say that?
There’s a problem with the analogy. We expect prices to respond to the money supply with a lag of a year or so. The CO2 concentration affects net energy in, hence the rate at which temperature is rising. It’s only with long lags that it determines the equilibrium temperature–long as in at least centuries.
If that isn’t obvious … . As the Earth warms, the amount of heat it radiates out increases. Increase heat in by X and eventually Earth will warm enough to increase heat out by X, at which point it is again in equilibrium. But that takes a very long time.
David, right, there’s a ton of things I’m leaving out. E.g. rising CO2 is supposed to have a logarithmic, not linear, effect, and conventional air pollution in the 1950s and 1960s supposedly reflected sunlight back into space. But the standard suite of climate models ten years ago would (and did) predict higher temperatures today because of higher CO2. And would Bernie Sanders want to go on TV and so, “Sure, in 50 years the average temperature for that decade might be 0.3 degrees cooler than this decade, but we still need to act now to avoid catastrophe”?
On what basis do we know it takes a very long time?
For any given place on Earth, the lag between the day with the most sun and the typical hottest period of the year is only about two months. Then six months later the surface cools down again. Random natural variation between one year and another year is quite high so clearly each patch of surface adjusts temperature at the slowest within one year.
But if each patch of surface can adjust within one year, then the surface as a whole can too, I would have thought.
If you go deep into the Earth like a cave, or you look at the Argo buoys which go deep under the ocean, the temperature doesn’t change much, and the amount that it does change is irrelevant to surface radiation anyhow, and at least an order of magnitude less variation than the surface temp. Unless we saw large changes at that depth I suggest we can just ignore it.
The amazing thing about the Earth is just how stable the temperature is, which is something the climatologists have yet to provide any explanation for. Well, that’s not exactly true, they had an explanation regarding the stabilizing effect of water, but then they “forgot” about that and decided scaring people was a better business model.
CO2 is one of many forcings for temperature. If temperature does not go up it in response to one forcing, this can in principle be easliy explained by changes in the other forcings. What are the other forcings for price inflation that would make this a sensible analogy?