Believing Is Seeing: Noah Smith Reagan Record Edition
Besides my contributions to the rehabilitation of the fine art of karaoke, one of my favorite contributions to humanity is the phrase, “Believing Is Seeing.” (It is self-affirming since many of you probably initially read the post title as, “Seeing Is Believing.”) Today’s example comes from a recent Noah Smith blog post, where Noah wrote:
The U.S. federal deficit, which had been decreasing since the end of WW2, began to trend upward beginning around 1980: [Smith then inserted a chart of federal debt.]
Why? Well, the proximate cause was big tax cuts, without any offsetting spending cuts. The beast was not starved, and tax cuts did not pay for themselves.
Then Noah goes on to give a theory to explain this “fact.” And yet, he never really established the premise of his argument. Even though “everybody knows” that the Reagan Administration ran up huge deficits because of irresponsible “tax cuts for the rich,” it’s not obvious that this is what happened.
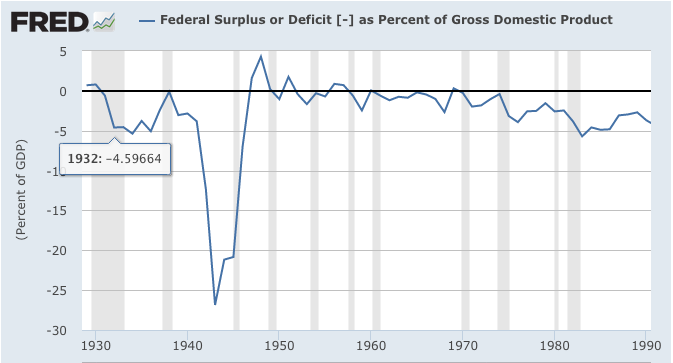
First, let’s look at the federal budget deficit, as a share of the economy, to get a sense of historical context:
There are a few takeaways from the chart above. First, the budget deficits of the Reagan years weren’t unprecedentedly large looking at any year in isolation. For example, they were comparable to the “do-nothing” Herbert Hoover’s budget deficit in 1932, and there were isolated years in the decades following World War II where the deficit was in the same ballpark as the Reagan years after the early 1980s recession. (The deficit sounded unprecedented in the 1980s because people were hearing it quoted in absolute dollar terms, not as a share of the economy.) The reason the federal debt (as a share of the economy) mushroomed so much in the 1980s–as Noah shows in his post–was that there was a consistent string of large deficits; it wasn’t that the deficit in any particular year was that much larger than it had been under previous Administrations.
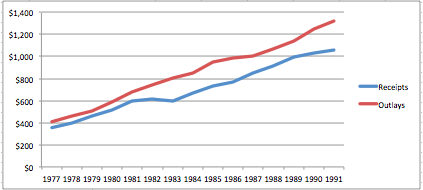
Now let’s look at the level of federal spending and tax receipts (in historical dollars), using the White House historical tables:
The above chart is calibrated in billions of historical (i.e. not inflation-adjusted) dollars. As the data indicate, there was no point during the Reagan years during which federal revenues actually went down. They treaded water for two years during the worst economy since the Great Depression, but then they began rising again.
Now Noah might be tempted to say that the trend under Carter was clearly interrupted by the tax rate reductions of the early 1980s; federal spending continued its typical growth, while receipts never recovered from the shortfall of the recession years.
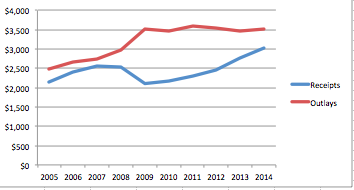
If that’s how Noah wants to interpret the chart, fair enough, except I would ask that he be consistent. If we use the above chart to rate Carter vs. Reagan, then we should do the same thing with Bush vs. Obama:
To repeat, if Noah thinks it is obvious that the debt problem under Reagan was due to irresponsible tax cuts without comparable spending cuts, then it shouldn’t be a problem for us to find posts from 2009 and 2010 where Noah is decrying the irresponsible tax cuts of the Obama Administration. Indeed, federal tax receipts didn’t even recover to their pre-recession levels until a good three years after Obama took office.
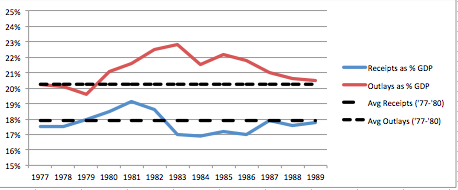
Finally, let’s look at federal outlays and receipts as a percentage of GDP:
The above chart shows that if we compare federal outlays and receipts during the Reagan years to their average values under the Carter years, we conclude the following:
(1) Federal spending under Reagan (as a share of the economy) was consistently and much higher than under Carter.
(2) Federal tax receipts under Reagan (as a share of the economy) were higher during the recession years than under Carter, and for the middle three years were moderately lower than they had been during the Carter years.
So, if you are OK with the way I’ve chosen to slice and dice the data in that last chart, we would reach the exact opposite conclusion from Noah Smith: Namely, the explanation for the explosion of federal debt during the Reagan years is that the federal government took in about the same share of the economy (over the whole period) in receipts, but increased spending.
In conclusion, let me admit that Noah could play with Excel and probably come up with a different way to make his case; there is a lot of wiggle room depending on how we treat Fiscal Year 1981, for example–is that a Carter year or a Reagan year? (Fiscal year 1981 ran from October 1, 1980 through September 30, 1981. Ronald Reagan was elected in November 1980 but not sworn into office until January 20, 1981.) Even harder to evaluate, do we count the big rise in tax receipts as a share of the economy in 1981 and 1982 as due to deliberate policy, or as due to the collapse in economic output during the awful recession?
All I’m trying to do with this post is show that the standard progressive line that the 1980s were due to “tax cuts for the rich” is hard to square with the facts. For sure, it is impossible to simultaneously maintain the progressive narratives regarding Herbert Hoover, Ronald Reagan, and Barack Obama. They would have to adjust their metrics and definitions between presidents for their stories to hold up.
One last thing: I am NOT defending the “Reagan Record” in this blog post. If the Reagan Administration had lived up to the wonderful speeches of the Gipper, then we wouldn’t have these arguments. If President Reagan had actually signed into law massive “spending cuts” as his critics often allege, then nobody would dare suggest that “tax cuts for the rich” had led to a fiscal problem.


(1) “There are a few takeaways from the chart above. First, the budget deficits of the Reagan years weren’t unprecedentedly large looking at any year in isolation.”
What are you talking about? Reagan’s deficits were the largest since WWII up to that point. Your chart clearly shows this.
(2) “For example, they were comparable to the “do-nothing” Herbert Hoover’s budget deficit in 1932, “
As always with libertarians on Hoover the ignorant unwillingness to understand that the deficit as a percentage of GDP is a function of deficit/GDP x 100. If GDP crashes dramatically, even when a deficit is not that large, the deficit to GDP percentage soars. This is what happened from 1929-1933 when GDP collapsed by -26.8%. The rise in the percentage you see in your chart was mostly the result of GDP crashing, not massive Keynesian stimulus. Your chart even shows a federal government surplus in fiscal year 1930 (July 1, 1929–June 30, 1930)!
The deficit percentage then is NOT properly comparable to the situation in 1980-1985, where GDP collapse was only -2.2% between Jan–July 1980 and −2.7% between 1981–Nov 1982.
In fact, in 1929 total federal expenditures were ONLY about 2.5% of US GDP, whereas in 1980 they were about 20%.
The result of GDP crashing, not massive Keynesian stimulus. The result of GDP crashing, massive Keynesian stimulus. Bah ha ha ha ha
The Bush/Obama’s deficit of 2009 was also largest since WWII… you know that budget Bush requested and Obama signed off. The one with the TARP and the massive Keynesian stimulus package… not to mention fighting two major wars.
Clearly caused by tax cuts right?
By the way, in that same chart I can count six deficit events, all of them “largest since WWII up to that point”, must have been a lot of tax cutting going on. Strange that the clear trend from 1950 to 1990 was larger deficits as a % of GDP, but during the same period, Federal tax receipts as a % of GDP were trending upward (check that on FRED if you want).
Astounding what those tax cuts keep doing.
Those vertical grey bars on the FRED chart represent recessions, and you might notice there was on in the early 1980’s.
Hopefully this link works, trend line isn’t optimized to best fit, but I can’t find the calculator on FRED to do that. Federal tax receipts show an upward trend (which turns around in 2000, as do many macro indicators).
http://research.stlouisfed.org/fred2/graph/fredgraph.png?g=14Lt
I calculated the best fit in Excel. One of us should see whether Excel Online can do that.
Oh, and thanks for letting me know there’s a linear trendline option in the new FRED2-one year and two days after its introduction.
I suspect “receipts” includes more than “tax receipts”, the latter not being on as strong an upward course.
Hmmm, well I would say that all receipts must offset the deficit… unless there’s new and interesting accounting I haven’t met yet.
I guess that receipts for services rendered might be justification for higher government spending, but that opens a can of worms in terms of monopoly services and what is a real tax anyway. For that matter, what is a real service? Besides, the whole point of this conversation was to get Noah (or LK, or anyone) to admit that there’s a spending problem. First we have to get them to admit that spending even happens, which is proving difficult.
Accounting mysteries resolved:
http://research.stlouisfed.org/fred2/release/tables?rid=53&eid=5272&od=2014-07-01#heid_5274
The big story is “Contributions for government social insurance” are not counted by the government as “Current tax receipts”. Heh. Just like CIA “targeted killings” are totally different from those illegal CIA “assassinations”.
Oh gum, I shouldn’t have asked. Clinton accounting you say?
The “social insurance” receipts looks similar in shape to other tax receipts so I don’t think it changes anything in principle, but thanks for the heads up… they could diverge at any time. I think the general plan is to blend inter-class wealth transfer with inter-generational wealth transfer to the point where no one can tell the which is which.
Australia made some good decisions to put “superannuation” into private hands with a competitive system of funds, thus making it more difficult for government to raid it. They may eventually take it, but there will at least be a fight. Symbolically significant if nothing else.
You were right about “Believing is seeing” in LK’s case.
First he says:
“What are you talking about? Reagan’s deficits were the largest since WWII up to that point. Your chart clearly shows this.”
So because the deficit as a percent of GDP rose, we are supposed to infer from this that the Reagan Administration positively increased the deficit. In other words, we are to make a naive interpretation of the chart based on the absolute value of the deficit to GDP.
But wait, there’s more!
“If GDP crashes dramatically, even when a deficit is not that large, the deficit to GDP percentage soars. This is what happened from 1929-1933 when GDP collapsed by -26.8%. The rise in the percentage you see in your chart was mostly the result of GDP crashing, not massive Keynesian stimulus.”
So now a President’s administration is not the story after all. Now GDP is identified as a variable that can change, which can affect the deficit to GDP percentage. And oh look at that, there was a steep recession in the early 1980s, the worst since the Great Depression up to that point, where GDP fell significantly (although not “crashing dramatically”). Still enough to explain why there was a pronounced increase in the percentage.
LK again contradicts himself.
It looked to me like these were two different points.
BM:”First, the budget deficits of the Reagan years weren’t unprecedentedly large looking at any year in isolation”
LK: ” What are you talking about? Reagan’s deficits were the largest since WWII up to that point. Your chart clearly shows this.”
To me this is a description of the chart, and has no implication for why the chart is shaped the way it is. RPM says the chart is not unprecedented in this region, LK says it clearly has no precedent since WWIII. I suspect if you plot it out only since WWII the region in question would be visibly starkly lower than the rest. There is some argument about whether post WWII is the appropriate criterion, but a cursory look would suggest that they were at least unusual, if not unprecedented.
The second point is clearly an explanation of the shape of the graph. This is separate from the first point and does not contradict it. This explains why the graph gets to low points in the 1930’s for reasons that were not present in the 1980’s. Nobody looked at the graph in complete isolation. Otherwise the large deficit from 1942-1946 rather stands out. As an illustration, why did RPM not say the deficit was much greater during the war? This because everyone would immediately have pointed out that conditions were different then. It did not require pointing out. LK is just pointing out that the 1930’s in his opinion were also different enough to not be considered part of the “normal” conditions, and so the low point in the 1980’s was unprecedented.
Harold,
Yes they are separate but that isn’t how LK dealt with them. I took his approach and showed he is being inconsistent in the mixing.
Look at how LK responded to Murphy’s purely descriptive statement of the size of deficit under Hoover. The quote from Murphy that LK labelled as (2).
LK’s response was not that Murphy’s description was factually wrong, but rather that Libertarians apparently fail to understand or address the reason.
LK did combine what you say should be separate, so you should be replying to LK with your valid point.
Interesting post. I recall Milton Friedman saying in an interview that the early 1980s recession and the fall in inflation were crucial to understanding the Reagan deficits, though I don’t think he claimed that they were entirely responsible.
By the way-
“Even harder to evaluate, do we count the big rise in tax receipts as a share of the economy in 1981 and 1982 as due to deliberate policy, or as due to the collapse in economic output during the awful recession?”
Presumably you mean “big fall in tax receipts”. And from the charts, the fall seems to be in 1982, not 1981, which would make sense because 1981 was a yo-yo year in which the growth rates of NGDP and RGDP rose relative to 1980, before Volcker finally put his foot down in late 1981/1982.
Good minds think alike.
What he probably meant was that budgets had been constructed under the assumption of continued high inflation. When disinflation happened, spending continued it’s previous rate of growth as if inflation were still late 70’s levels.
I don’t think this is a great argument. It amounts to saying the Treasury had no faith in Volcker actually succeeding in bringing down inflation.
For me, the more important point is that at no point during the Reagan Presidency, did the Republicans have even a small majority in the House of Representatives-expecting a Republican President to be able to get Democrats and moderate Republicans on board with unpopular spending cuts is and was a pipe dream.
A lot of people think divided government has the result of taming the deficit, and I think that’s somewhat true: Republican Congresses under Democratic presidents seem to hold the line on spending while revenues catch up. The other kind of divided government, in which Democrats control the legislature and Republicans the presidency, doesn’t seem to work: See the last 2 years of Bush, the Reagan presidency. For the brief period during the Bush years when Republicans had an undivided government, however, they ran big deficits-on the other hand, from 2004 to 2007 the deficit as a percentage of GDP was declining.
However, I find this kind of reasoning insufficiently methodologically individualist. What matters is not what party controls what parts of government, but what kind of people control the party that controls the branches of government. If the Gingrich Congress had been in place under Reagan, they probably would balanced the budget. If the Bush Era Republicans had been in place under Clinton, they might not have (they might have, too, it’s hard to say, I think).
Would the current Republican party balance the budget under a Republican president? I think that very much depends upon the President in question. Would they do it under a Democratic President? Well, they haven’t yet.
The point was more bracket creep.
Bob Murphy,
Interesting, but I don’t understand why tax receipts would stay high while GDP fell.
W. Peden, as a share of the economy, tax receipts were very high (for this period) in the early 1980s.
Yes, I have a slight mistake since I said tax receipts in absolute dollar terms didn’t fall at any point, when they slightly dropped in one year early on.
“As the data indicate, there was no point during the Reagan years during which federal revenues actually went down”
-Er… 1983. As by your chart.
“Reagan’s deficits were the largest since WWII up to that point. Your chart clearly shows this.”
-Agreed.
And this is why I am often suspicious of Bob’s reasoning.
My reasoning in response to Noah’s post (in the comments) is, however, in my opinion, excellent.
FY 1983≈Calendar Year 1982
http://research.stlouisfed.org/fred2/series/FGRECPT
“To repeat, if Noah thinks it is obvious that the debt problem under Reagan was due to irresponsible tax cuts without comparable spending cuts, then it shouldn’t be a problem for us to find posts from 2009 and 2010 where Noah is decrying the irresponsible tax cuts of the Obama Administration.”
-Good one. It’s sad that Reagan’s tax increases are so often forgotten, but his tax cuts remembered, while Obama’s partial repeal of the Bush tax cuts is remembered, but the tax cuts of 2009 are forgotten.
Nice post. A few more points:
1. Notice that when Reagan left office, federal tax receipts were 17.8% of GDP- higher than all but six years between 1946 and 1978 and all but three years between ’46 and ’66.
2. Net interest payments were unusually high during those years- generally around 2.5 to 3% of GDP.
3. During the early 80’s recession, the deficit increased from a low of 1.6% of GDP in FY1979 to a high of 5.9% in 1983. That’s certainly a big increase, but compare that to the most recent recession when it increased from 1.1% in 2007 to 9.8% in 2009. The deficits in ’09, ’10, ’11, and ’12 were all larger than the largest deficit in the 1980’s.
Also, the phrase “Believing is Seeing” is hardly Bob’s own contribution to humanity since it’s been around since at least the 19th century:
https://books.google.com/books?id=SuAXAQAAIAAJ&pg=PA40&dq=%E2%80%9CBelieving+Is+Seeing.%E2%80%9D&hl=en&sa=X&ei=KRELVcTbO7KBsQSzqICQBA&ved=0CDUQ6AEwAzgK#v=onepage&q=%E2%80%9CBelieving%20Is%20Seeing.%E2%80%9D&f=false
I’m telling you, people, these errors, insignificant in themselves, add up quickly.
http://www.breitbart.com/london/2015/03/27/why-climate-change-is-a-moral-crusade-in-search-of-a-scientific-theory/
Guys, the Federal budget is not that complicated. My results in Excel give me a .6582 R2 between the ratio of Federal expenditures to receipts and the unemployment rate (this version of my first chart in the relevant Smith post optimized to most clearly show the correlation):
http://research.stlouisfed.org/fred2/graph/?g=14Kf
Seeing is believing.
So this must be the oft-sought-for structural deficit:
http://research.stlouisfed.org/fred2/graph/?g=14Kr
Note: anything below a 1 in this graph is a structural surplus.
Notice that, if anything was extraordinary about the Reagan years, it was that fiscal policy was extremely tight during the second Volcker recession! This confirms my claim in Noah Smith’s comment section: “Reagan was a frickin’ tightwad compared to Bushama, 2008-Fiscal Cliff.”.
It’s almost like there’s some sort of tax, that only happens when people are employed.
Good graph though. Interesting to note that the overall trend is still upwards.
A lot of that is probably the military draft in the U.S. and rapid expansion of government employment as a share of the labor force before 1973. It would be easy to lower the unemployment rate by a percentage point just by moving that percentage point into the military and into the civilian government. In much of Europe, BTW, the labor market degraded to a much greater degree after 1973 than in the U.S.
OT:
Neat chart:
http://www.zerohedge.com/sites/default/files/images/user5/imageroot/2015/03/nyt%20curve%201_0.JPG
First to LK. I think what Bob is saying is the deficit was not caused by the tax cuts to the rich. I would suggest based on the numbers that I have looked at, that it is due to the increase in outlays. Hence the issue is not in ‘cuts’ in taxes but rather increases in spending. Which supposedly has a more stimulative effect right.
Anyway historically from the 50’s to the mid 70’s Outlays were around 18% of GDP. However with the promises of Social Security and Medicare additional mandatory spending started to take shape in the mid 70’s. This Bumped us up to the 20% in the outlays.
See http://www.usgovernmentspending.com/spending_chart_1950_2020USp_16s1li011mcn_F0f
Now during Reagan it DID peek up to 22% of GDP, which is of course way too high.
The average amount of direct revenue the Government gets can be seen here
http://www.usgovernmentrevenue.com/revenue_chart_1950_2020USp_16s1li011mcn_F0f
which varies between 16% and 18% of GDP. In fact whenever the Government is earning more than 17.5% I think it is time to get ready for the next Crash as that revenue is often times generated by capital gains from market sales. Of course that can NEVER happen again right? Especially not with Mrs. Janet Yellen on the case…..
I still believe the next market crash will happen mid 2016 to mid 2018. ( I learned my lesson from believing the housing bubble would go in 2005 ) With the most likely crash occurring after the next president is elected. ( Do we get to blame Obama at that point? ) Course there are several variables that may change this, but I do not see any of these actually being played out.
Anyway the point is that increased outlays NOT a decrease in revenue was responsible for the deficits. I think that is what Bob was saying and I agree with that.
Look at the broader context,:
http://research.stlouisfed.org/fred2/graph/?g=14Tn
Keep your eye on the blue line. Note both Federal spending and Federal revenue as a percentage of GDP fell under Reagan. Note also that the tax cuts weren’t at all big. Smith is wrong. The “proximate cause” was not big tax cuts, but a double-dip recession (see my above comments; there was a huge “full-employment surplus” during Reagan’s first term). I, however, think that Federal revenue didn’t rise enough during Reagan’s second term.