Is Market Monetarism Pining for the Fjords?
Scott Sumner has a new post at EconLog saying that Keynesianism isn’t just resting (in reference to the famous Monty Python “Dead Parrot” sketch). Scott does a great job busting Mike Konczal, who earlier in 2013 had said the year would be a great test for market monetarism vs. Keynesianism. Since the Keynesian warnings about the horrible effects of the sequestration (and government shutdown) totally blew up in their faces (I will document this in a separate post at Mises Canada), Scott is perfectly justified in raising his eyebrow at Konczal’s victory dance now that 2013 has closed.
But being the paragon of mercy and understanding that I am, I wanted to understand how it was possible that Konczal and Sumner could look at the same data, yet each walk away with an opposite verdict. And you know what? The answer is that Konczal wasn’t looking at Keynesianism per se. Rather, he was looking at NGDP growth, and concluded that the story didn’t match what Sumner needs. Specifically, Konczal wrote: “2013 brought us a fiscal deficit that closed far too fast, NGDP growth and inflation falling compared to previous years…”
And here’s the NGDP graph that Konczal linked:

Does that surprise anybody else? From reading Scott’s blog all these years, I sort of expected “the tightest monetary policy since Herbert Hoover” to show really low annual NGDP growth during our abysmal recovery, but that it started picking up in 2013, the year that Scott tells us has been vindicating market monetarism. (Remember, Scott’s original ideal target rate for a healthy economy was 5% NGDP growth.)
Now I know, I know, Scott advocates level targeting, meaning that we have to catch up to where NGDP would have been right now, had we never hit the catastrophe of falling / slowly rising NGDP in 2008-10. But my point is, of course Scott can reconcile the data to his story; anybody can do that. (It’s why Krugman, Scott, and I all think the past 5 years have totally vindicated our basic stories.) But be honest: Did you expect the NGDP graph to look like the above?
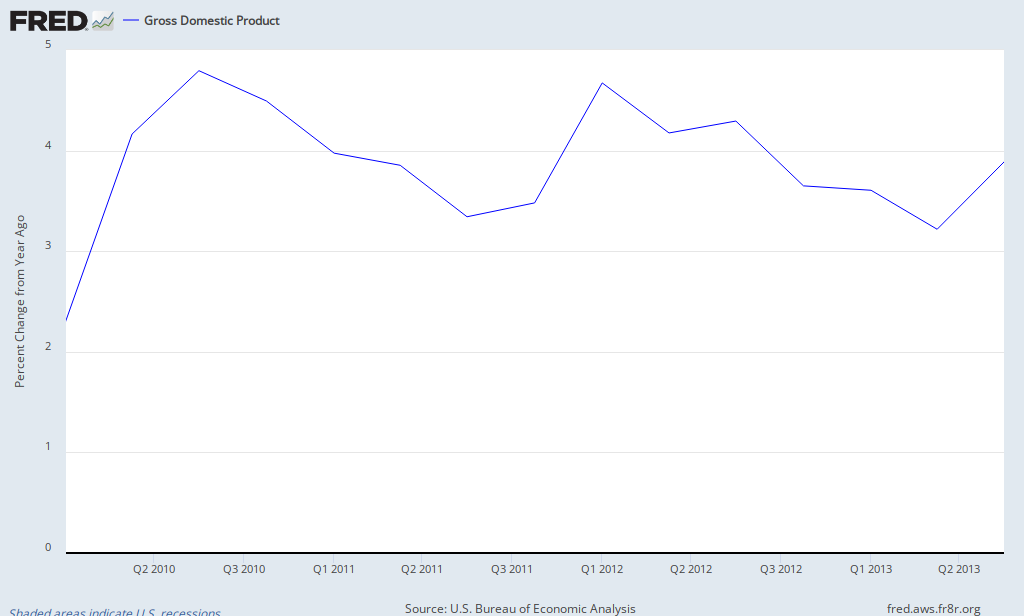
Let me give an even better test that puts more pressure on Scott: If his theory is correct, then we should have seen price inflation and real GDP growth moving cyclically, since 2008. (I’m not just speculating; I’ve seen Scott say this explicitly, for example when a QE announcement increases inflation expectations and Scott says it’s proof that QE is “working.” Please give me a link if you can find one.) That’s because in Scott’s view, extra demand (from looser monetary policy) will mostly get sopped up by an increase in real output, but it will also show up in accelerating price inflation.
And yet, I think we arguably see the opposite:

In the above graph, we see that from 2010 onward, there are three distinct periods where the movements in price inflation and real GDP growth are mirror images. To repeat, that’s the opposite of what Scott’s story requires. They should be moving together, at least while we remain below “potential GDP” (or full employment or whatever term Scott prefers).
Don’t get me wrong, I have no problem with Scott dismissing the above chart as irrelevant, or even somehow (heroically) arguing that it just proves how right he is. That’s because in macroeconomics, there are 57 moving parts, and all of us (Austrians, Keynesians, and Market Monetarists) can always tell a story after the fact.
Rather, my purpose in this post is to get Scott and his followers to see that if you just entertain the premise for one moment that our economic woes aren’t because of “tight money,” there are lots of data to comfort you.
When it comes to macroeconomic theory and the data, believing is seeing.


If I say that rising AD boosts inflation, that doesn’t mean that rising inflation implies AD must have risen, does it?
Second, if you plan to show the graph that Konczal showed, you should explain why it’s wrong.
Third, NGDP plunged in 2009 and unemployment soared to 10%, since then NGDP has risen at the slowest rate during any economic recovery of (probably) the last 100 years, and yet unemployment has fallen to 7%. Exactly how does that contradict my theory? Do you think unemployment should have fallen slower or faster given the 4% NGDP growth during the recovery?
What will falsify your theory then, Scott? I ask the same thing for Keynesians.
What if there is more than one way for NGDP to gradually rise over a timespan of 4 years, given an initial money supply and volume of spending?
What if NGDP plunged because employment and investment plunged first? What if the reason NGDP fell during 2007-2009 is because saving and investment fell first?
What if your explanation that NGDP fell because the Fed didn’t inflate the money supply enough, doesn’t address the question of why the Fed found itself in a world where it had to inflate more in order to prevent such a large decrease in aggregate spending at all? What good is a theory that doesn’t address the causes for why so many market actors would suddenly increase their money holding times?
What if output and employment SHOULD fall at times, if it just so happens that the existing investments and labor allocations are unsustainable in real, physical terms, and that corrections take time, replanning takes time, all of which should be allowed to run their course?
What if more inflation doesn’t solve the problem of misallocated capital and labor, but in fact exacerbates it?
What if the *only* reason NGDPLT appears to be a superior policy, is because it calls for more inflation than what took place, which is the only way to delay the corrections that prior, more modest inflation has caused?
Market Monetarists believe that when real output is too low, slower wage growth will result in more rapid real output growth and lower inflation. That is, some version of the long run adjustment process to the natural rate.
For example, a shift to a lower growth path and rate for nominal GDP will immediately result in a recession, but over time. The new long run equilibrium will have output and employment little different from where it was before, but the price level and level of nominal wages will both be lower, and growing and a lower rate.
The adjustment process will involve more rapid growth in real output and employment and lower inflation and wage growth than the new long run equilibrium. The inflation rate is lower so that the price level falls down to its new equilibrium growth path, and real output grows more rapidly to catch back up to potential.
Market Monetarists favor a return to the previous growth path and rate. If that were to occur, there would be higher inflation and real output grow. The price level would be catching back up to its previous growth path, and real output would be growing back to potential.
So, sometimes inflation and real output growth are both high, and sometimes one is high and the other is low. Old fashioned monetarist adjustment process.
As for the first diagram–nominal GDP continued to grow despite a slowdown in federal government spending and tax increases.
What if inflation caused the very problems that you believe more inflation could have solved?
I should have proofed that!
Late, but I think this graph would explain. When NGDP drops both CPI and RGDP tend to drop. When NGDP is stable, CPI and RGDP have -1 correlation. Precisely what MM aims to.
http://monetarypolicytesc.blogspot.com/