Follow-Up From Pat Michaels on Jerry Taylor’s Climate Model Argument
In a recent post, I linked to a 2015 blog post from Jerry Taylor. I was concerned that his own chart showed the opposite of what he claimed. Specifically, it seemed that the climate models that were published in the 2007 IPCC report had overpredicted actual warming from 2007 forward. And since you can calibrate the models (by adjusting parameters such as the reflectivity of aerosols in the atmosphere), the fact that the models “match” the observations before 2007 is not so reassuring.
In a comment at my post, climate scientist (and Cato scholar, and my co-author) Pat Michaels wrote this:
Of course, because of the discrepancy between the models and surface average temperature, the difference between modeled and observed ocean-only readings is large, and post -1998 only matches the models during the recent El Nino (too bad this reply section will not accept an illustration).
There’s the further problem that Taylor tries to sweep away: The satellite/radiosonde comparisons with the IPCC model average show a huge error in the vertical in the tropics. Given that the vertical stratification is what determines tropical precipitation, that means the modeled rainfall is systematically wrong. Given that the presence of surface water dramatically alters the partitioning of incoming radiation (less sensible heating of wet surfaces), that means the daily thermal regime is also mis-specified, which will further screw up the rainfall etc…
At any rate, as shown by Hourdin et al. in the latest Bulletin of The American Meteorological Society, the models are tuned to match the 20th century surface history often with physically unrealistic adjustments, possibly a cause of the huge vertical error.
Because Pat said he wished he could post an image, I emailed him and offered him the option. He took me up. So below is the chart he wanted to post, along with his further commentary:
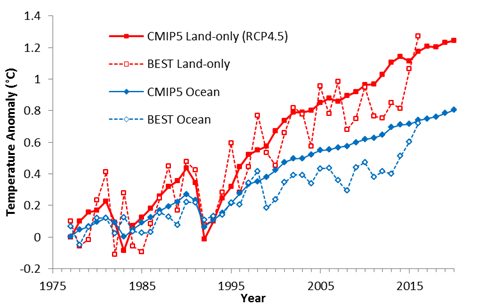
Many things to note. Even in the land-only, the CMIP model mean tends to be too warm post 1998. You will also see that by showing the real datapoints that the fit looks much less fortuitous than in Jerry’s post. And in the other 70%–the ocean surface—every post-1998 datapoint is below the model average, and it only gets close in the recent El Nino. The consequence of getting the ocean surface warming rate wrong is that means the flux of water vapor is being overestimated (it may be tuned in retrospective mode) for the near term and in the future. The calculated water vapor feeedbacks have to assume the forecast is correct, which it most clearly is not.
That leads to a further speculation: If the water vapor flux is wrong in the models (too high) that means that the models will consistently overpredict temperature, so I would surmise that the only way they can match is if they are tuned. I’m sure you have seen Hourdin et al. in BAMS. And that just scratches the surface, so to speak!
PJM
Pat then added in a final email: “[D]on’t forget to re-emphasize that the models were tuned to match the past which is why they fit El Chichon and Pinatubo.”
Maybe the commenters in the previous thread would care to do a least squares regression in their heads but it looks to me like the fifty year trend lines in the data would be below the trend lines in the models.
Would the trends be statistically different? Is it reasonable to fit to 50 years? Could there be a change of slope?
Why separate out land and sea? Why not simply use the up to date global data?
Maybe your point is a “gotcha” on Jerry Taylor, but that seems a bit petty compared to the issues at stake.
The fact is that the models were running hotter than the measured data, but just within expected bounds – certainly was pushing it close. Had it continued for much longer I really think the modellers would have had to re-think. However, it did not continue, the temperatures have now come up and we are well within expected range.
The models are clearly not perfect. Maybe they are a fraction hot, maybe not, but they are doing a pretty good job of modelling something a compex as the global climate. Pat does not say what the anomaly is compared to, but we can see that the land anomoly is currently at 1.3C. Not long ago people were talking of trying to keep temperature anomaly less than 1.5C. We are already reasonable close despite El Nino negative or neutral conditions for the last 10 months.
Make your points about the ecomomics of climate change, but the data says the mainstream climate science is pretty much on track.
“We are already reasonable close despite El Nino negative or neutral conditions for the last 10 months.”
There tends to be a lag of several months between a change of ENSO conditions and then we’re looking at annual data so we’re not going to see drop back toward trend just yet.
“Would the trends be statistically different?”
The more important question is whether they would be climatically significantly different. We can’t tell that from eyeballing, either.
” Is it reasonable to fit to 50 years? Could there be a change of slope?”
This you can tell pretty well from eyeballing, and apart from the volcanic eruptions you can see that the models are approximately linear trends on average over the last 50 years.
“The fact is that the models were running hotter than the measured data, but just within expected bounds – certainly was pushing it close. Had it continued for much longer I really think the modellers would have had to re-think. However, it did not continue, the temperatures have now come up and we are well within expected range.”
All the models aren’t wrong, only most of them!
“Not long ago people were talking of trying to keep temperature anomaly less than 1.5C.”
“Many people are saying” I see.
“Make your points about the ecomomics of climate change, but the data says the mainstream climate science is pretty much on track.”
Given I’ve done more active climate research than economics research, you can stuff it, and also, no, it actually does not.
It actually does matter quite a lot that the long term trend is near the bottom of the model distribution, which is actually reinforced by it taking a strong El Nino to bring the anomaly up to the mean model anomaly. Mainstream Climate Science (TM) is represented by the middle, not the edge of the distribution of models.
“Maybe your point is a “gotcha” on Jerry Taylor, but that seems a bit petty compared to the issues at stake.”
Pretty petty to catch Jerry Taylor engaged in willful deception?
Actually my comment about economics was aimed at Bob – that was not clear from the positioning of my comment.
““Would the trends be statistically different?”
The more important question is whether they would be climatically significantly different. We can’t tell that from eyeballing, either.”
Not sure what your point is here. You are talking about the slopes being different. A statistical difference is evidence that the slopes are in fact different. How would you propose to test if they are climatically significantly different? We can’t tell from eyeballing, so we would need to do some statistical test, surely?
“There tends to be a lag of several months between a change of ENSO conditions and then we’re looking at annual data so we’re not going to see drop back toward trend just yet.”
Just to be clear, you are predicting that the temperatures will drop back? How long will it take? Lag is reported as 6-9 months, and the peak was well over a year ago, so I presume you are predicting pretty sharp drop in temerature any time now?
““Many people are saying” I see.” What do you see? The cliamte has warmed to faily close to the levels some people are worrying about. Many skeptics said these predictions were massively exagerated. This comment was simply to put the current temperatures into context.
“Mainstream Climate Science (TM) is represented by the middle, not the edge of the distribution of models.”
Which is exactly where we are.
“Which is exactly where we are.”
No, we are not. We appear to be because we have recently experienced some warm side weather noise.
“Just to be clear, you are predicting that the temperatures will drop back? How long will it take?”
Atmospheric temps have been below their peak and generally trending down for several months already.
“Not sure what your point is here. You are talking about the slopes being different. A statistical difference is evidence that the slopes are in fact different. How would you propose to test if they are climatically significantly different? We can’t tell from eyeballing, so we would need to do some statistical test, surely?”
Actually no, my point was that if the models are sufficiently noisy, and the data is also noisy, a very large difference in trends that is obviously climatically significant wouldn’t necessarily be statistically significantly different.
A difference that may amount to a degree in a century could easily be within the uncertain of a trend line. That’s obviously climatically significant.
Of course, unless you actually do the slopes, which you are oddly resistant to doing, because it “wouldn’t be appropriate”, we can’t know if the trend lines are statistically significantly or climatically significantly different.
My best guess is that right now the trend is statistically significantly different from more than half the models, but on the low end of the full distribution, above the 5th percentile.
Important point here: different models contain different approximate physics, so it does matter to try and figure out which models work best, and it does matter if the ones which work best are the ones which warm least.
“Of course, unless you actually do the slopes, which you are oddly resistant to doing,”
I am not resistant to doing so, just that “doing the slopes” has a different objective than these graphs have. Iam all for conducting statistical analysis (of which dong the slopes is one aspect), but you seem oddly resistant to this.
It is not appropriate for these charts to do the slopes, because as soon as you do so you are making choices you have to justify, for example the start date. If we were to zoom in on the last few years do we need to plot the slope just for that section? Of course not. But the choice of 50 years is itself zooming in on the whole instrumental region. But data gets better as we get closer to present. Where do you start? If we go back a bit more we do get changes of slope.
So yes, there s a place for dong exactlythat – for selecting start dates and justifying them, calculating slopes and correlations. But these charts are ot that place.
Regarding the climatically different, I still don’t quite get your point.
If the model says a slope of 1C per decade and the actual is 0.9999C per decade that is climatically different but not statistically different. The models are bound to be different from reality, and they are modelling climate, so it seems to me that they are bound to be climatically different.
I think this must be something of a reflection on the ” all models are wrong, some are useful” insight. The models will be wrong, but are they useful. Is that it?
“Atmospheric temps have been below their peak and generally trending down for several months already.” and “is statistically significantly different from more than half the models, but on the low end of the full distribution, above the 5th percentile.”
So you are predicting that the data will revert back to the previous trend after the El Nino has got out of the system, and the 2017 annual data will be back to just above the 5th centile? That seems to be a good summary of your expectations, but I may be wrong.
It’s a struggle to take any of this stuff seriously. The earth is 4.5 Billion years old, give or take 50 million years. Modern forms of humans have existed on the planet maybe 200,000 years. So on a 24 hour clock we have been here for what? A minute and a half?
It would be like me seeing someone blink and reach a conclusion they always have their eyes closed. And we are supposed to take a 50 year chart seriously?
Funny, I see people take charts of share prices and currency fluctuations over the last week seriously. Funny that, given the universe is 13.7 billion years old. Or maybe the age of the Universe /Earth / mankind really has no bearing on what should concern us now.
How ignorant of us not to consider the previous 13.7 billion years of stock market activity. For shame, economists!
Is there a Nobel Prize in the field of false analogies? Because I nominate that.
There was no mention of ignoring the previous 4.5 billion years of climate history, nor the non existent 13.7 billion years of stock market history. The suggestion was that the Earth is 4.5 billion years, so 50 years is a blink of an eye. That applies to stock markets as well as climate.
If you or Mike Mc wishes to construct a different argument you are free to do so and we can discuss the merits.
No need to construct something different. Misuse of analogy on your part.
An individual’s time horizon for investing in relationship to market history is materially different than 50 years against 4.5 billion. That should have been obvious
Mike, your comment does not make any mention of why the fact that the Earth has a long history means we should not consider a 50 year span as significant. 50 years is a significant span in human terms, which applies just as much for shares as it does to climate.
Perhaps you would care to say why the fact that the Earth has a long climate history means we should not consider 50 years significant?
Just to get you started, say we had a chart showing temperature rising 10C over the next 10 years. “Doesn’t matter” says Mike, “The Earth has had a climate for 4.5 billion years. Are we supposed to take a 10 year chart seriously?”
It seems trivially obvious that we should take such a chart very seriously and the previous duration of the climate has no bearing on the seriousness of the chart.
If you can explain why the duration of the Earth’s climate means we should not consider 50 years significant then please do so. Unless you do I cannot know why you would think that.
Harold,
Two points:
First, you abandoned your investment metaphor so I will bring it back to illustrate the point. Assume you’re 25 yrs. old with a 50 yr. investment time horizon. Would you base your strategy and reach conclusions about your macro strategy on a 5 second chart? Of course not
You say we should take the chart seriously yet it would be absurd to do so in the broader context. There are bigger things at play that affect climate that the chart provides no helpful insight on whatsoever. Solar activity cycles, long term wobbles of the earth’s orbit, shift in the magnetic poles etc etc.
BTW I agree with your citation further down that the evidence suggests that changes in the macro environment cited above is what increases the carbon in the atmosphere (in oceans or the permafrost) and not the other way around. But that conflicts with the political narrative of climate change.
Mike, ” Assume you’re 25 yrs. old with a 50 yr. investment time horizon.”
We don’t have to assume – within the time frames we are talking about that pretty much describes the situation you and I are in.
“Would you base your strategy and reach conclusions about your macro strategy on a 5 second chart? ”
No, but nobody was talking about a 5 second chart – you discussed a 50 year chart.
A 50 year chart is exactly the sort of time frame that should be taken seriously. 50 years is the time frame over which the effects will play out in our lifetimes.
I don’t know why you think otherwise. I could speculate, but unless you tell me I don’t know.
”…but nobody was talking about a 5 second chart – you discussed a 50 year chart.”
YES against a time frame of 4.5 Billion years.
You seem to be having trouble intellectualizing the concept of relative time and cause and effect
Why should I use a time frame of 4.5 billion years? I live in a time frame of decades. Unless you can explain why a time frame of billions of years is more approriate for me to consider, then it looks like 50 years is the right sort of time frame for me to take seriously.
Sometimes things seem so obvious to us that there appears to be no need to explain. I suspect this is one of those times and you think I am just being objectionable. But seriously, I do not know why you think I should be thinking on a time scale of billions of years just because the word is old.
Ok I will try this one last time.
CONTEXT. You seem to think 50 years is meaningful in terms of predicting earth cycles. It is not. 50 years is nothing to the earth. Therefore attempting to assign a meaningful interpretation for predictability purposes of a 50 year chart is folly.
Yes you have to live in it but don’t think it bears any meaning to what climate is actually doing or our impact on it.
“You seem to think 50 years is meaningful in terms of predicting earth cycles.”
I did not mention cycles, and I most certainly do not think that. I don’t know if there are earth cycles.
“Therefore attempting to assign a meaningful interpretation for predictability purposes of a 50 year chart is folly.”
If you think logically, this is not valid.
To illustrate, say I have a 2 million year old rock under a hammer. I can look at the history of the rock, which is quite stable, except for a daily cycle of gentle warming and cooling. But if I hit it with the hammer all of that history is entirely unuseful in predicting the future of that rock.
From this we can conclude that a history, however long, does not constrain the future.
The previous history of the Earth’s climate cannot therefore invalidate concerns about the future of the Earth’s climate.
Again, I do not see why the fact that the world is old should meant that we should not be concerned over decadal climate trends.
I cannot provide your side of the argument. You have to do that. Otherwise I am just arguing with myself.
“Again, I do not see why the fact that the world is old should meant that we should not be concerned over decadal climate trends.
I cannot provide your side of the argument. You have to do that. Otherwise I am just arguing with myself.”
This is why debating someone like Harold is pointless and time-wasting. Mike Mc, don’t even bother.
Richie:
“I cannot provide your side of the argument. You have to do that. Otherwise I am just arguing with myself.”
This is why debating someone like Harold is pointless and time-wasting. Mike Mc, don’t even bother.”
Do you think I should provide both sides of the argument? Seems an odd way to go about debate.
Harold, you nailed it with your stock market analogy. Not sure why the others don’t see it.
I cannot for the life of me figure out why the age of the earth is relevant here if we’re trying to determine the effects of the last 100 years of carbon emissions.
If people want to argue that temperatures have fluctuated over the lifetime of the earth, that’s fine, but their “earth is really old” argument works against them then: Yes, temps have varied, but over thousands or millions of years. The fact that temps have risen a lot in the last few *decades* is a really big deal given that variations usually take a few orders of magnitude longer than that.
Thank you, The Original CC. I am never sure why people fail to see what appears obvious to me.
Equally, they seem to be unsure why I don’t see what appears obvious to them.
I often attempt to find out where these differences arise, but I usually end in failure, which is slightly disheartening.
Sometimes I find that what I thought was obvious was wrong, which is why I continue to engage in dialog.
It’s not “the earth is really old” argument. It’s proper context.
Assigning credible predictive value to a 50 yr chart is very appropriate if your frame of reference is 200 yrs. Not so much if the frame of reference is 4.5B years. I’m not saying the 50 yr chart is without value. I’m saying its needs proper context for the argument it is being used to support.
Antropogenic global warming advocates will trot out a 50 or 100 yr chart and yell “we are doomed unless we do something now.” So we should set public policy and reorder the economic system without rational context?
“So we should set public policy and reorder the economic system without rational context?”
I am struggling to understand why you think the climate 500 million years ago is a rational context to consider policies that will affect the next few decades.
There were no people then.
Struggle harder ;-).
Did you know that modern humans, who have barely existed for 200,000 years, possess enough power to wipe out most of the life on this planet? And this is power that we’ve acquired in just the last 70 years.
The life on our planet IS sensitive to our most recent actions. Time passed is irrelevant.
Non Sequitur. What humans have the “capacity” to do has absolutely no bearing on the argument to support the argument for anthropogenic climate change.
What humans have the capacity to do has no bearing on human induced climate change? Interesting point of view.
Toby,
It’s not interesting at all, just obvious. Perhaps you are having trouble discriminating the differences.
I own a car. You walk across the street. I have the capacity to run you over. If we find you lying in the street it does not follow I ran you over. There are a host of reasons why you might be laying in the street.
Yes Humans have the capacity to cause material damage to the planet. So what? Capacity not yet exercised does not add the conversation of current climate change. Should not be the hard to understand
Of Course the Global Climate Models run hot. That fact should be beyond dispute even among the climate change alarmists. Here’s a graph from IPCC AR5 WGI Technical Summary. http://www.climatechange2013.org/images/figures/WGI_AR5_FigTS-14.jpg The top graph shows a whole bunch of global climate model runs overlayed with observational temperature data. The global climate model runs are differentiated as “Historical” (meaning they were calibrated to match the observational temperature record) vs. “RCP” where RCP stands for Representative Concentration Pathways. The RCP runs presumably do not throw in all the parameter adjustments used to get the “Historical” model runs to match the observational record but instead the RCP runs use “representative” values for those parameters. These RCP runs are the “out of sample” or forecast runs that are the true test of the predictive ability of the models. All the RCP runs RUN HOT as you can clearly see in IPCC’s own data. The observational record lines up with the very bottom edge of the ensemble of the RCP models. Lest there is any doubt about the models running hot you can note that IPCC goes on to say the best estimate of near term (2016 to 2035) global temperature anomaly is the LOWER HALF of the model predictions. If the models did not run hot then the best estimate of the near term temperature anomaly would be the middle range of the model predictions.
Here’s the IPCC AR5 WG1 Technical Summary if you have insomnia. http://www.ipcc.ch/pdf/assessment-report/ar5/wg1/WG1AR5_TS_FINAL.pdf
Were running hot, now not so.
Egg on my face update:
So, I asked myself what if I updated figure TS14 from IPCC AR5 WG1 Tech Summary with the latest global surface temp anomaly data from here
https://data.giss.nasa.gov/gistemp/graphs/customize.html
Here is the result:
http://i68.tinypic.com/238qc9.jpg
The 2016 global surface air temp anomaly (Yellow Line) is right smack dab in the center of the RCP climate model results.
Of course 2016 might prove well to be an unusually high El Nino spike.
Harold,
It’s true that 2016 had a global average surface air temp that was near the center of the range of predictions from the AR5 RCP models. So, that might seem to be a win for the climate models and the AGW alarmists. But 2016 was an El Nino year. The issue that the models when used for out of sample predictions tend to overestimate climate sensitivity to CO2 hasn’t gone away because of one or two anomalously warm years.
Capt. Parker – Excellent graph you posted there. The issue has not gone away – there will always be refinements. We will see what happen. But for now we are in the middle of the predicted range.
After the last big El Nino there appeared to be something of a “step change” – the temperatures did not drop back to those before the El Nino. It is not certain that this will happen again, but it is certainly possible.
We are supposed to believe these things don’t get “calibrated”.
They are “bottom up” remember? Just type in the laws of physics and everything else comes right out of that. No room for calibration whatsoever.
Tel, the models are bottom up, but depend on inputs, just like economic models. They are not going to reconstruct the climate from the big bang are they?
I am not saying that the models are purely theoretical, but what models are? We observe the moon going round the Earth, and we propose a theory of gravity, and we use the observed behavior to calibrate the model by establishing values for things like like the gravitational constant.
Climate models are very complicated, and they require lots of inputs and calibrations, but they are still based on physical laws. That is not inconsistent with some calibration being required. So of course there is room for calibration of models based on physical processes.
The alternative extreme would be to observe the data and fit a line to it, then extrapolate the line with no consideration of the underlying physical processes. That approach does not work.
“The alternative extreme would be to observe the data and fit a line to it, then extrapolate the line with no consideration of the underlying physical processes. That approach does not work”.
But for some process like the effect of aerosols the modelers aren’t even able to get a use physics to determine if the effect on climate adds or subtracts from warming. So, given that level of imprecision in the underlying physics calibrating the models becomes not much different from observing the data and fitting a line to it.
“not much different from observing the data and fitting a line to it.”
It is different because the models are structured differently. The models consider the effects of aerosols using known physical processes, such as reflection and absorption, which cool or warm the planet. Sulfates reflect almost all the radiation, carbon black aerosols absorb. So grouping all aerosols into one category may be misleading. However, if the amounts of the aerosols are known and the amount of radiation they absorb or reflect is known, a properly constructed model will produce the right result.
You can argue that these factors are not known well enough to produce a useful answer, but I maintain that this is quite different from observing the data and fitting a line to it.
“You can argue that these factors are not known well enough to produce a useful answer,”
And I so argue.
“but I maintain that this is quite different from observing the data and fitting a line to it.”
We agree that the problem with the curve fitting approach is that the reliability of predictions from such a model is low. I maintain that the reliability of predictions from models where multiple parameters must be adjusted through large ranges in order for the model to replicate historical observations is equally low.. We would both think it unwise to allow the curve fit models to dictate policy decisions (see for example The Lucas Critique) I believe it is just as unwise to allow the current climate models to dictate policy decisions.
I do agree that the model based on underlying physical properties has a possibility of being improved to the point where it does give reliable predictions whereas the curve fit model can never be trusted (I think this is analogous to Lucas’ desire for microfoundations in macroeconomic models) . But that does not mean that a physical process model won’t be as error prone as the curve fit model if the values needed to construct the physical process model are not accurately known.
Capt. Parker, we can agree to differ on the reliability of the models. It seems to me that they have done a pretty good job so far and provide a pretty good basis for policy, although the uncertainties must always be acknowledged.
Here in Michigan, aka “The Water Wonderland”, I never realized that the mile thick ice cover was here less than 20,000 years ago. I figured a million years ago. That’s not taught in government school. Apparently, the ice melted all on its own and turned into some lakes.
https://tinyurl.com/j9lgb83
Bob,
How did that happen without us driving around in SUVs? An inconvenient question is suppose. pun intended
We don’t know for sure, but recent research suggests it may be due to CO2 release triggered by solar irradiation changes. It has been long known that Milankovich cycles meant more sunlight in the North from about 20,000 years ago, but this does not seem to be enough to cause a global change quickly enough. The hypothesis is that this caused some melting of the Northern ice cap, rapid sea level rise and dilution of the Northern Atlantic. This reduced the gulf stream, so the warmth went South instead of North. This heated the southern ocean which resulted in release of CO2.
This explains why the warming apparently precedes CO2 increase in Antarctic ice cores, but not globally.
https://www.nature.com/articles/nature10915.epdf?referrer_access_token=WjRVf5ukBQFHQ_q0BKvHXNRgN0jAjWel9jnR3ZoTv0Np5ubGZZNBAsXWOqI-1XaGloQYVNMBjI0Mr0_vCCSpEUPktPWx3huhR2RsPpVYQpuY7RgSoNV4cO0SVbshN9YkxWe2u-ZJA-OdD-dTjq84m2B62jYvqHoPnSLp2PRmY3doEBX-kCilv19bCE9vCt2BrKnTOy67ysawUsCFvbGkWyUUKrjBucRxi5X6ifzqHo9nfS3p6yVx9FlDn7cKycv2&tracking_referrer=www.scientificamerican.com
Officially we are in the middle of an ice age. They discovered quite distinct cycles of 100,000 year duration (that’s one full period) in a number of different ice cores.
https://en.wikipedia.org/wiki/100,000-year_problem
The larger portion of the cycle is heavy ice (glaciation), and a relatively small portion of that cycle is not iced up (know as the “interglacial”) which is the bit where we are sitting now. These cycle of glaciation followed by interglacial have only been happening for the past 2.5 million years (when the modern ice-age started) but even stranger than that, roughly 1 million years ago the dominant frequency changed (earlier cycles were dominated by a 40,000 year period). For humans in the near term future, trying to stay warm will be our major problem… not Global Warming which is a non-problem.
It’s interesting when you hear the environmentalists wringing their hands over the Great Barrier Reef and how it might react to half a degree change in “global temperature”. That reef is approx 6 million years old, has survived ALL of these glaciation / inter-glacial cycles and goes well back before that where the historical climate was much warmer than today. It has survived far greater climate shifts than humans have ever been confronted with.
Milankovitch cycles are the common explanation for the 100,000 year cycles (actually it’s a little more complex, there are a few different orbital cycles working together), but not a good explanation for why it started happening 2.5 million years ago, nor why there was a shift in dominant frequency. I note that the link above astutely ignores Henrik Svensmark’s cosmic ray theory, and I’m confident that if you attempted to link to that it would be quietly erased. That’s the politically unpopular theory so the smart money says he’s probably correct. You know Max Plank’s explanation of scientific advancement…
Tel,
But we are supposed to take a 50yr chart seriously right?
The ice cores and ocean sediment measurements simply don’t have the fine resolution to see year by year. So it’s only in the past few hundred years that we have records where someone measured the temperature every day… and the oldest ones are obviously not global.
Thus, there’s not a whole lot to compare in terms of concluding what’s “normal” for the past 50 years. The oldest is Central England.
https://en.wikipedia.org/wiki/Central_England_Temperature
We can see significant variation around 1700 which was known to be a cold patch, and we see a local warm peak just after 2000. From other non-thermometer records we know that the Romans grew grapes so it was warmer back during Roman occupation. When you check records of the River Thames frost fairs you get these totals (from Wikipedia):
Hence you can see the effect of the cold patch in the 17th C. and into the 18th a.k.a. the “Little Ice Age”.
Besides that, the supposedly “global” temperature is glued together by a horrible process of adjustments, plus it contains urban data with local effects… I don’t take it all that seriously. There’s hot years and cold years everywhere you look. Average those down and there’s warmer decades and cooler decades, it varies around by a few degrees. That seems to be pretty normal.
Our farms are more productive than ever. Partly because the extra CO2 does make plants grow, partly because we manufacture artificial fertilizer, partly because we have selectively bred better plants (although humans have always been doing that) and technology has improved. Adaptation is the answer.