Everyone Relax: Largest Hedge Fund Says No Bubble
A CNBC story tells us that Bridgewater Associates–a hedge fund overseeing $169 billion in assets–recently sent a note to clients arguing that the U.S. economy was not in a bubble. The story summarizes the note’s main points:
Factors arguing against a bubble are, according to the authors:
- Prices have increased quickly, but not as fast as other bubbles
- Valuations are still in “normal territory”
- Leverage isn’t a major driving force of prices and overall lending is still “modest”
- There aren’t any significant new investors entering the market
- U.S. retail and foreign investors have “modest” positions
- Corporate stock buybacks are sustainable
- Economic sentiment is “less ebullient” than other bubble periods
In short, Bridgewater doesn’t think the situation today is analogous to the Roaring ’20s, the dotcom boom of the late 1990s or the housing-fueled bubble of the mid-to-late-2000s.
Some of those bullet points are hard to quantify, but the second last one is rather ominous: It’s bad when hedge funds are reassuring people that corporations can keep buying back their stock in order to keep prices from collapsing.
And look again at the first bullet point, which claims that prices haven’t risen as quickly as in other bubbles. Well, here’s the S&P 500:
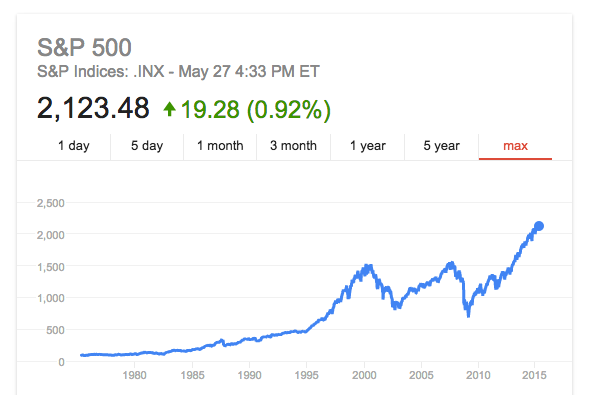
The rise since mid-2011 is pretty steep, blowing the housing bubble period out of the water, and comparable to the late 1990s’ dot-com run-up. If the U.S. government had implemented all sorts of pro-growth policies since 2009, I might be comfortable with the above chart. But actually the last six years have seen a huge increase in federal debt and a big increase in the federal takeover of health care, to mention just two big whammies. Nobody knows the future, but I think the stock market is clearly in a bubble–with a little help from our friends at the Fed.


So, you are using the canard about firms boosting their share prices by using buybacks instead of dividends, but then you also claim that it is a sign of a bubble because share prices are going up quickly without adjusting for the reduced share count.
Firms have never been less leveraged nor held more cash, and equity risk premiums are basically as high as they have ever been, especially after adjusting for the low leverage and large cash positions.
And, you’re seriously eyeballing rates of change on a graph with a linear scale?
Come on, Murphy. This is amateur stuff.
Kevin,
Here is a little better look… Of course this all depends on where you create your start and and points but if you go off of what Bob suggests in 2004 to before the bubble burst in 2007 ( high point of the S & P ) the Average annual gain of the S&P was about 13.6%… Compared to the annual increase since 2011 of closer to 17%.
As for your part about ‘less leveraged’ this is sort of true but the times they are a changing…
http://www.wsj.com/articles/u-s-firms-shoulder-rising-debt-1430689085 and the real question is WHY are companies in such a good position? Because of low borrowing costs. Now this does not mean the sky is going to fall, but it does cause a bit of pause. Just because a company is in a good position right now does not mean it will be in the future. Competition from a world wide venue and local competition should begin to cause issue with the economy as rates increase and competition becomes a little more fierce. I stick by my prediction that the next recession will occur between June 2016 to June 2018. That it will be a mild recession and should only take two years to recover from. But that the next big one is about 10 -15 years out and will hurt like the dickens.
Now a great many things can change my view on this but thus far everything seems to be lining up for this to occur and the fast rate of stock price increases are just one of the signs of this.
Course this is simply oppnion
Kevin,
Here’s the log scale. Aren’t my two statements true?
I never said “without adjusting for the reduced share count”; those are words you’re putting in my mouth. I did a whole article in the Lara-Murphy Report on share buybacks. I think they are an ominous trend in the last few years, even though in general they need not be.
Of course, what’s funny in all of this is that even if the stock market crashes this year, you guys will just say, “No one could have known, efficient markets, if you complain long enough you’ll eventually be right, blah blah.”
Bob, Saturn is in the 3rd quadrant while Sagittarius reigns. That is the real reason there will be a stock market correction sometime in the next 4 years. But I suppose when my prediction comes true, you’ll have some lame excuse ready.
Great, so the only thing I have to do is, pull all my money from negative interest rate threatened saving deposits from my bank, and buy the S&P, and don’t care for at least 4 years. Even a correction is no problem since it is only a correction..
So easy is investing who would have thought!?
😉
And I guess I should use some leverage.. nothing can go wrong.
But I guess I don’t even get a lame excuse if it does go wrong..
Also I find it funny when people believe they knew it all along, when all they did was getting lucky on a coin toss…
And yes, with this unprecedented setup now in the markets, it really is a lucky call if you get it right!
This isn’t that hard. Two things are both true:
1) the main concern with investing in equities is exposure to cyclical risk.
2) The signals for cyclical risk that Bob is using here are poor – possibly worse than random.
You haven’t shown how they are poor.
Kevin,
“This isn’t that hard.”
This is exactly my take away from your comments. However I don’t trust you on this.
To cyclicality:
As things look like the late 1990s in the S&P it really doesn’t look at all that it is just cyclical, but much rather fundaMENTAL (emphasis on “mental” on behalf of technocrats). Just like the Nikkei is a prime example for this as well. And THAT is easy to spot in my opinion. But where to go from here? No clue! Depends, apart from many things, especially on our ‘wise’ technocrats.
“As things look like the late 1990s…”
This should better be:
“As things look like now in the S&P, at least since the late 1990s, …”
I see, Kevin. You call what I’m doing “amateur” because I use a linear scale, I show you I’m right using a log scale, and you drop an insult and walk away. And you think you’re the scholar here.
I apologize for the “amateur” comment.
I didn’t say I was a scholar. It doesn’t take a scholar to see that you’re operating with a bad model here.
You seem to have an underlying expectation that the market as a whole is unstable and pro-cyclical, but you are talking about debt fueled equity bubbles when corporate debt and equity risk premiums are at the opposite extreme and trends in bank credit have shifted sharply downward over the past decade.
He just said buybacks are sustainable. That’s all he said. What do you think is unsustainable about them? He didn’t say it was to keep stock prices from collapsing. You said that. How in the world does buying 3% of shares outstanding over the course of a year keep share prices from collapsing? Corporations have been returning around 5% in payouts, more or less, for decades. What is it about buybacks vs dividends that is suddenly going to make that stop?
Debt fueled bubbles are CREDIT EXPANSION fueled bubbles.
They are not corporate debt fueled.
If a bubble period contains large quantities of corporate debt, then these are transfer type payments that do not fuel anything at the level of the economy as a whole. Every corporate debt issuance is exactly matched by savings. This cannot possibly be fuel for a bubble.
Kevin’s just been brainwashed by TheMoneyIllusion.
Their crusade is to attack any and all mentions of “bubbles”. They apparently they don’t exist because EMH.
The only lame excuses I see are his reasons why there cannot be a bubble.
He wrote:
“Firms have never been less leveraged nor held more cash, and equity risk premiums are basically as high as they have ever been, especially after adjusting for the low leverage and large cash positions.”
Yet a credit expansion / inflation financed boom WOULD entail large cash positions by firms. It is ridiculous to believe that bubbkes caused by inflation are synonymous with low money balances.
As for risk, Kevin’s comment is not only “amateur”, but laugh out loud absurd. A bubble WOULD entail higher risk premia. What is risk premia? It is the excess return over the risk free rate. When stock prices rapidly accelerate, as they have done, and when the risk free rate is all but zero, as it is, then of course risk premia would be higher! To say that a higher premia counts as evidence against stock prices being too high proves Kevin has no clue about basic finance.
“And, you’re seriously eyeballing rates of change on a graph with a linear scale?”
When the starting points are the same thenOH I see Murphy already answered that.
So when investors are willing to accept large discounts in order to avoid equity risk, you consider that a sign of a speculative bubble?
Equity risk premiums in the late 1990s were very low – to the other extreme from where they are today.
Before that, the last time they were this high was during the 1970s. Were equities in a bubble then? I’m pretty sure that monetary policy was loose then.
Investors are not accepting large discounts though. They are paying the very high and continuing to rapidly increase stock prices.
The capital gains that result, coupled with the very low risk free rate, is what is generating the high risk premia.
Your model is fundamentally flawed, because it is based on the assumption that a high risk premia somehow implies muted stock prices. But rapidly increasing stock prices is itself a factor that raises the equity risk premia!
Monetary policy was loose during the 1970s? Why? Because of the price inflation?
Inflation of the money supply over and above the best estimate for what would have taken place in a free market of money is the best measure of the stance of monetary policy.
One reason for why this is the case is that inflation of the money supply does not affect all prices equally.
If the Fed buys $10 billion a month in treasuries, and in counterfactual world A people use that money primarily to consume more, whereas in counterfactual world B people use that money to primarily invest more in stocks, then according to your definitions, world A would result in loose money, and world B would result in tight money.
Yet the only difference is what people chose to do with their money.
Using the better definition of money in excess of market, worlds A and B would have equally loose or equally tight monetary policies.
This is far more reasonable than NGDP, which is only a subset of everything that people can spend their money on.
If you say the 1970s was “too loose” because of NGDP, then you would be (falsely) reasoning from a spending change.
BTW Kevin, it’s not crazy to eyeball a linear chart for rates of growth…when the starting point is the same on all three upswings.
S&P500:
May 2015 2121
May 2009 919
131%
Dec 1999 1469
Dec 1993 466
215%
Why not use March 9th, 2009? Just an itty bitty difference of two months.
I was just using a 6 year window with monthly numbers to make it easy. But, now that you mention it, if I use the intra-day low point in March, which was famously 666, the total return since then has been….wait for it….218%.
Touche, Mr. Ward. Touche.
This sounds a bit sarcastic to my ear. “Comparable” seems an apt description, don’t you agree?
No, not sarcastic. It really does make the number comparable.
Loosely related question for Austrians out there:
in theory, if money keeps being printed but it does not get in circulation (say banks hold on to it), is it possible that price inflation never comes? I’ve heard many say yes, but it seems to me it isn’t, because the new money, though not spent, goes to preserve the existing structure of production, which then becomes more and more corrupted. But shouldn’t then society become less and less productive? Shouldn’t we see an inflation driven not by increasing money but decreasing output? Thanks for explanations.
Maurizio,
I am not a strict Austrian so I will not say what others may comment on this. However by inflation I am assuming you mean CPI? Under the Austrian definition of money any increase to the money supply regardless of whether it makes it into circulation ( else why print it ) is inflation of the money supply.
As for CPI that should in a perfect world inflate and deflate depending on economic conditions. For instance when supply outstrips demand there should be price deflation and when demand outstrips supply there should be price inflation. Hopefully the only time you see decreasing output is when the cost of investment is more than the value of the good or some other scenario akin to this. So if something is not worth what you are paying for it you stop paying that much for it, and the people producing it cut back on production to create a new equilibrium. etc and so on.
I suppose I am confused by what you mean by existing structure of production.
It’s impossible to quantify this but the natural order of society is to become more and more productive and that positive effect may outweigh the negative effect of money printing, etc. for a long time. In my view, this partly explains the relatively low consumer price inflation so far.
The definition of money is unfortunately a bit subjective, like many things.
Suppose Bob and myself send the same silver dollar back and forth repeatedly between us. Has that increased circulation? Suppose we skip the physical dollar and just send IOU notes back and forth by email, does that also count? We could boost world GDP or something.
The definition of inflation is also subjective. If the things I buy go up in price, that’s inflation as far as I’m concerned.
Now I know why you and Bob agree so much! I feel shafted!
“I’ve heard many say yes, but it seems to me it isn’t, because the new money, though not spent, goes to preserve the existing structure of production …”
The bubble structure of production would have to be preserved by printed money. That’s why entrepreneurs are continuing to engage in long-term production for finished goods the production of which consumer demand hasn’t justified.
But if the money was printed, but never spent, then, yeah, it would have no effect on the economy.
One caveat to consider is whether or not the banks realize that it will never be spent; If they consider the printed money to be savings, then they will treat it as money, and when they finally do decide to lend or spend it, the money will eventually make it to those who spend the most on finished goods, and then prices will begin to rise.
This interview may be of interest:
So Where’s the Inflation? Tom Woods Talks to Mark Thornton
http://www.youtube.com/watch?v=n0RusrwYsRE
Ah! the Krugman trillion dollar coin! I think I have that in my loose change/penny jar.
“in theory, if money keeps being printed but it does not get in circulation (say banks hold on to it), is it possible that price inflation never comes?”
The price inflation would take the form of increasing prices in whatever the Fed is buying.
Note that this does not necessarily mean a continual temporal increase in the prices of what the Fed is buying.
In the case of the Fed buying government bonds, then what could happen is that the government could keep issuing a larger and larger quantity of debt as measured in par value or principle, and instead of the amount fetched in return not increasing by way of non-increasing nominal demand, which otherwise would occur without monetization, in which case the price ends up being lower for each unit of debt, and thus higher and higher yields, the nominal demand for bonds with monetization keeps growing, and that leads to lower yields.
Imagine therefore a government that promises to pay back $100 billion this year, and $110 billion next year, and $121 billion a year after that. Imagine no monetization. Imagine taxes are pulling in $100 billion a year tops.
If you were an investor in government bonds, you would be faced with the fact that the chances of the government defaulting is very likely. The incentive to price these bonds at a very low price, is very high. The net result is the government can borrow less.
Now suppose the Fed promises to buy government bonds. Investors would likely know, or act as if they knew, that the Fed is not revenue constrained. They would know taxes are still $100 billion a year, but the incentive to give more money to the government is now greater.
This may show up temporally as either rising prices or even falling prices. The prices would be higher than they otherwise would be without the monetization. That is where the price inflation would be in your scenario.
In your scenario there is no explicitly stated increasing nominal demand for say consumer goods and capital goods. There is therefore no demand side cause for rising prices. Prices may however still rise, if production declines, and people come to expect no inflation.
Prices can only rise by either rising nominal demand., falling supply, or a combination of the two. No exceptions.
If your scenario suggests no rising nominal demand, then the only way prices can rise in the long run is by falling production.
“I’ve heard many say yes, but it seems to me it isn’t, because the new money, though not spent, goes to preserve the existing structure of production, which then becomes more and more corrupted. But shouldn’t then society become less and less productive? Shouldn’t we see an inflation driven not by increasing money but decreasing output?”
If the new money the banks receive is never spent or lent, then the corruption would be concentrated in the banking sector. Overall production would be adversely affected primarily by way of bad banking practises promoted and propped up by the inflation. The banks could make horribly misinformed loans, helping to bring about malinvestment in say the capital goods sectors, and when market forces are to liquidate those projects, in swoops the Fed to keep the badly managed banks solvent.
Whether or not this results in falling production is a question that always must be thought of besides two key factors: how long can it go on, and most importantly, knowing that everything we think about in economics is in terms of counterfactual, not temporal predictions of this and then that.
It is possible that production may for a time be associated with a temporally increasing aggregate supply, but then after some time, reality hits and production falls. Or it could result in sooner falls in production if the initial boom is significant. There is no one story to live by.
Isn’t the whole point behind those who don’t believe in the bubble that share buybacks don’t affect the stock price?
Buybacks, in lieu of dividends, increase the intrinsic value of remaining shares over time in proportion to the amount of shares purchased.
Buybacks do not create market prices significantly above intrinsic values.
Bob needs to correct his S&P500 graph for the first effect, which has caused growth in indexes like the S&P500 that ignore dividends to be overstated relative to earlier periods. But, he doesn’t adjust for the first effect, and he seems to believe, erroneously, in the second effect.
Your comment betrays the dividend irrelevance theorem.
If you claim the chart must be adjusted for dividend changes, and that will serve to satisfy the minimum adjustment requirements, then you would be making the same alleged error that you say Murphy is making. For you would have to adjust for asymmetric information effects, signaling theory, and tax effects.
Try to avoid pushing your conclusion by cherry picking those adjustments that would best fit your beliefs.
No. If I have a share for 2 firms that return 5% per year, one through dividends and one through buybacks, then this will be my position over time:
Year Share Price Cash
Dividend Firm:
1 $100 $5
2 $100 $10
3 $100 $15 etc.
Buyback firm:
1 $105 $0
2 $110 $0
3 $116 $0 etc.
Before you worry about the prices they paid, the signaling, and everything else, there is this simple mathematical issue with share price. Indexes that don’t track total returns are making an arbitrary distinction between the returns of these firms.
That assumes all else equal, when it never is.
That is precisely the problem you pointed out in what Murphy wrote.
If managers buy back stock, that has signalling and asymmetric information effects.
You cannot assume buybacks and dividends only have the difference you describe.
Plus your model leaves out a whole host of other criteria that would skew the “fair” prices pretty much any way you want.
The real world of stock pricing is much more complex.
I find that looking at a logarithmic graph is a lot let scary… (and more insightful)
https://i.imgur.com/xrABegT.png
Martin, how? On that logarithmic scale, isn’t it clear that the slope in the last few years is much higher than during the housing run-up, and comparable to the late 1990s?
My point is simply that the fundamental pattern here is exponential (straight line on log graph). It’s hard for my brain to grok that when looking at a linear graph. On a linear graph it looks like nothing happened until 1990 and then growth exploded. But no, all this time there has been steady exponential growth.
I don’t agree with all of what Kurzweil is saying
http://www.kurzweilai.net/the-law-of-accelerating-returns
but it’s taught me a lot about how counterintuitive exponential processes are.
There’s the growth for the sections of each period (roughly straight line) coming out of the dip. Also in 1995 there’s a notable change in direction.
http://postimg.org/image/ivaa694vh/
Seems to me a number of points come out:
[1] NONE of those growth percentages are believable as really representing long term growth, nor even short term returns on investment. I mean, the lowest (and longest sustained) was around 11% PA and if you had cash in your pocket you wanted to lend it out for a return, you would be very hard pressed to get 11% return on your cash, even if you were willing to take a few risks on that.
[2] Crashes in more recent times have been more violent than earlier crashes.
[3] To adjust for inflation and get a more realistic figure of growth you would have to scale them all back, but (supposedly) we are now in a low inflation environment, so the more recent figure would be adjusted by less than (for example) the Clinton growth boom.
[4] The market seems willing to run with these sorts of growth spurts for about 5 or 6 years in a straight run, and we are kind of at the end of one of those runs about now (although from 1977 to 1994 was a much longer run, but also at a lower growth and they were running at much higher inflation).
martin: If you are comfortable looking at logarithmic, then no, it is not less scary. The point of a logarithmic graph is to shrink the irrelevant changes and what you are seeing is a 33% historical increase in 2 years. And, as Bob points out, the late 90s are pikers, in comparison.
I’m putting my predictions down:
[1] consumer price inflation will ramp up over the next decade, especially for everyday items
[2] there will be another recession within the next few years.
That said, I think a lot hinges on the next US election. I know you guys don’t think elections change anything but 2016 seems to be a bit of a key decision making moment for the US politically. Probably the most likely outcome is that Jeb Bush wins and the most likely thing he would do is just more of the same… but I think there’s no guarantee of that.
The big question is US mortgage rates, check the chart:
http://research.stlouisfed.org/fred2/graph/?g=1cE6
So it’s one thing to have zero interest in a marketplace like government bonds where regular people are excluded, but how long can mortgage interest rates keep dropping? Difficult to say when that’s going to hit the “danger zone” but I’m guessing about 10 years and the trend we are seeing simply won’t be sustainable. The trend must end… only a question of when.
Would Bridgewater Associates gain anything if they convinced people USA was not in a bubble? Bob seems to think their evidence is not very robust, so if he is right, are Bridgewater deluding themselves, or pulling a fast one?
It seems to me that this is basically what Bob was saying when he lost the bet on CPI. The CPI was not the correct race and, if Bob had stayed true to his training, he would have bet on a measure of asset (S&P 500, for example).
With the Fed pulling the strings, this bubble could go on indefinitely. The traders (market) understand this; that is why the market gets so jittery every time the Fed suggests it might start acting rationally. (Note: one hedge fund does not a market make.)
“With the Fed pulling the strings, this bubble could go on indefinitely”
if it can really go on indefinitely, it is not a bubble I guess. A bubble needs to be unsustainable; there can’t be something that the Fed can do to avoid it.
Of course a bubble is not a bubble if it is sustained indefinitely nor can it really be a bubble until it bursts.
The inflation can go on until either no amount of additional acceleration in inflation can prop up the malinvestments because physical reality constraints are reached, in which case price inflation will accelerate, or the money printers seek to maintain their control over money, in which case they will refrain from continuous acceleration in inflation, which will then lead to a correction (recession/epression).
Our resident Market Monetarist, Kevin, wants everyone to believe that nice and stable inflation (defined according to them of course) brings about a free lunch.
MF, could you reply to my other question above? thanks
Done.
You gonna bet David Henderson again?
http://econlog.econlib.org/archives/2015/05/a_proposed_bet.html
Bob should counter-offer this way:
I’ll give you $500 now, if you argue with me about why Austrian Economics has never claimed to have granted predictive ability.
(I actually held that it did, when I first got to ConsultingByRPM.com, but if I recall correctly, I think even then I thought it was “predictive” in the sense of “it logically follows … if such and such”, rather than “this particular price or time”.)
Retry
I’m pretty sure Bob is right on the maths.
The issue is – is he right on the macroeconomics and/or the timing?
David Henderson thinks he is wrong on one or the other:
http://econlog.econlib.org/archives/2015/05/a_proposed_bet.html
I’m just a guy with a stock-portfolio and an inclination for free-market economics and (left) libertarianism – whats the story here guys ?
Another big reason for the high cash balances is that many people don’t want to be burned again as they were 2008-2009.
The more the Fed tries to “fight” this, given these circumstances, the more cash will be held.
It is OK to eyeball the slope of each of the stock market price trend lines in the chart.
This latest run up in prices has almost as steep a slope as the late 1990s dot com boom period.
We don’t need a log graph to make that point.