ICE Removals Under Trump vs. Obama
[UPDATED with more info about interior removals under Obama.]
I kept hearing conflicting statistics, but thanks to a commenter at Scott Sumner’s blog, I found the relevant reports to sort it all out.
So if you want to make it seem like Trump is deporting way more people than Obama–and both Trump’s fans and critics might want to do so–you can produce a chart like this:
So the above figure is looking at ICE activity from the day Trump was inaugurated, to the end of fiscal year 2017. Then it compares to the same time period, a year earlier. And yep, that’s a big surge. It either proves Trump is a heartless monster (if you’re a critic) or it proves he’s enforcing his campaign promises (if you’re a fan).
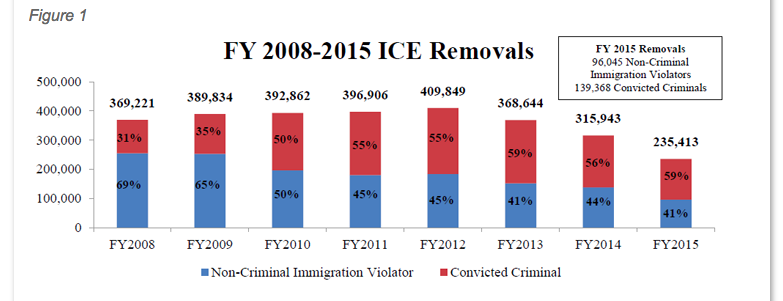
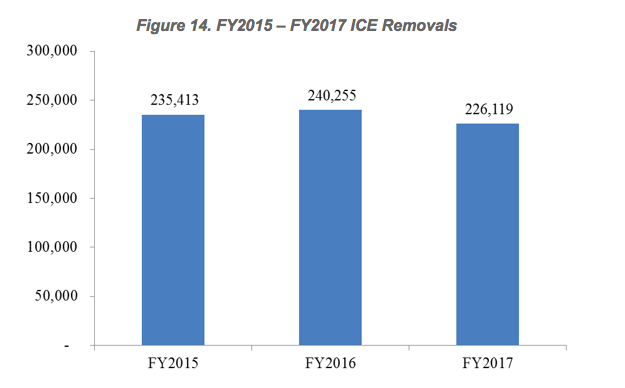
However, you may also have heard people throwing around stats suggesting that immigration removals are way down under Trump. If you want to make that case, you can grab Figure 1 from this 2015 report, and compare it to Figure 14 from the 2017 report. And look what you find:
vs.
Notice FY 2015 appears in both, and it’s the same exact number, so you know this is apples to apples. As you can see, when we look not just at “interior” ICE removals, but also include border removals, then in the first year of the Trump Administration, total ICE removals were about 45% lower than they were at the peak year under Obama.
I’m not drawing any conclusions from all of this, just trying to clarify what’s going on.
UPDATE: Whoa! I missed this on my first pass. Look at this:
So, under Trump, ICE had 61,094 “interior” removals (that’s taken from the first chart I posted above). But in FY2009, the first fiscal year under Obama, ICE has 237,941 interior removals. And that’s not some holdover from the Bush years. Three years later, the figure was 180,970.
For people freaking out about the number of people inside the US whom ICE has deported under Trump, it looks like the analogous figure for Obama was typically three to four times higher.


Trent: I believe the narrative was that attempted border crossings dropped like a stone when he was inaugurated, so that might explain the discrepancy.
Cathy Newman: So you’re saying that the US government should structure its immigration policy along the lines of the lobsters?
I thought a “border removal” just means someone was refused entry at the border and told to go back.
In other words, nothing to do with “removal” in the way most people would think about it.
Don’t get me wrong… it’s a GOOD thing they are doing checks at the border, that’s their job after all. Just that it doesn’t make a lot of sense to count this along with “interior” removals which are what people generally think of when they hear “removal”.
Consider for example if Trump’s wall actually works as advertised, would you count each person who gives up because of the barrier to be a “removal”? Probably not, you wouldn’t count them at all. This is the non-empiricism of Bastiat’s “seen and unseen”.
I am just explaining why some people are saying, “ICE removals are way down under Trump.” You can see ICE itself counts them as removals.
Tel I updated the post to show the “interior” removals during Obama years.
So basically the interior removals have been fairly consistently dropping during Obama years, 2nd term (from 234K in 2008 to 102K in 2014 to 44K in 2016) and are back to 61K under Trump. Too early to tell with high certainty (from the figures alone), but looks like Obama might have successfully tried to reduce the number while Trump is doing the opposite. Comparing Trump’s first year with Obama’s peak year probably doesn’t make much sense.
If I just gave a one-sentence stat like this, then sure, it would be misleading. But since I’m giving you guys all of the charts, and I’m explaining the different sound bites, I think what I said was fine. I’m trying to show why it’s also misleading to say, “ICE removals are up 50% under Trump!!” or whatever the exact number is.
Just eyeballing the charts it would seem reasonable to say something like “After 5 years of 20%+ declines in interior removals the first year of the Trump administration showed a 20% increase”.
Obviously we will need more years of data to see if this is the start of a new trend.
OK that’s fair Transformer.